

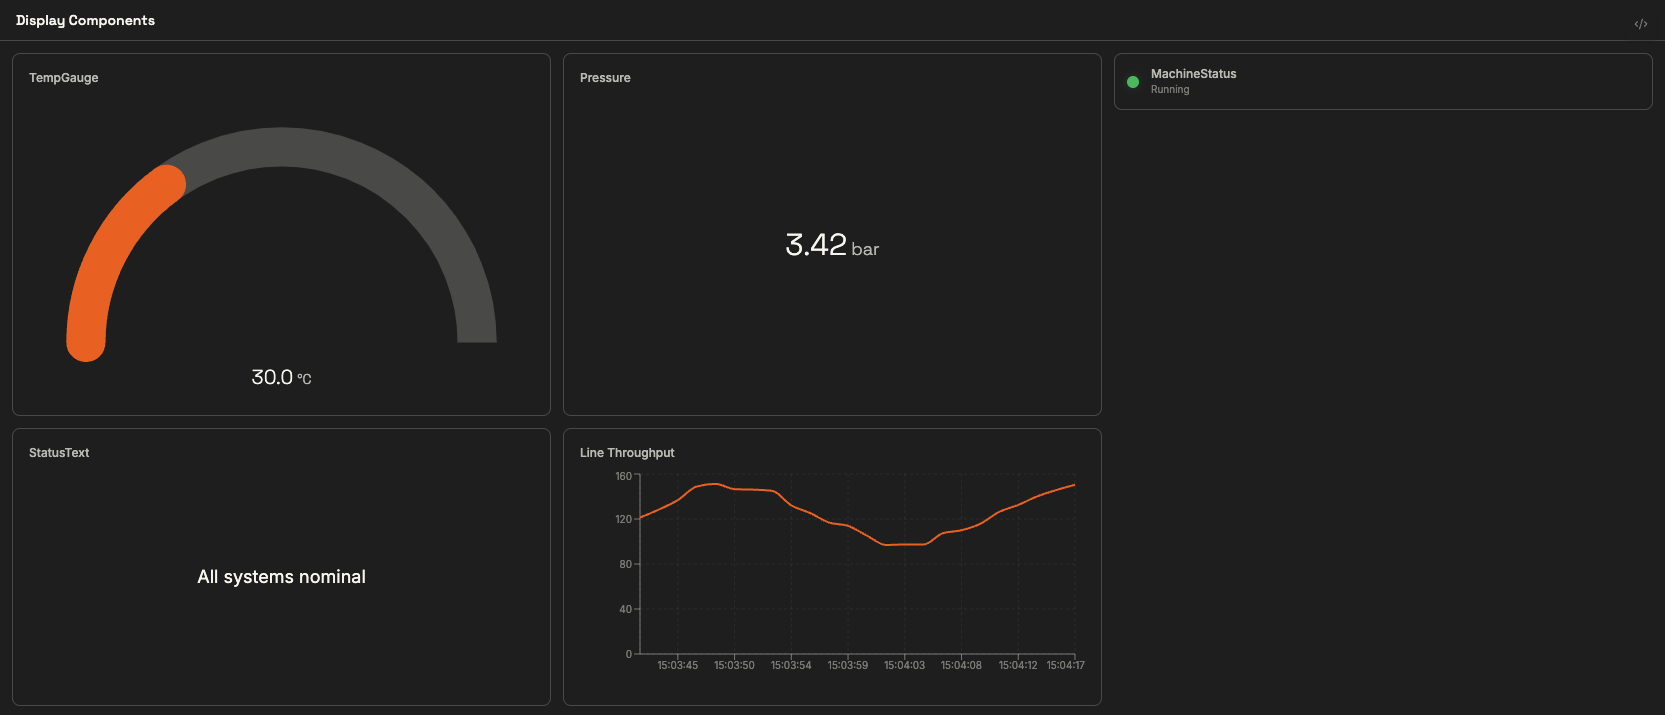
A showcase panel mixing the display widgets on this page: a gauge, a value readout, an indicator, text, and a live chart
Gauge
Circular (radial) or linear gauge for numeric values.- Basic
- Full example
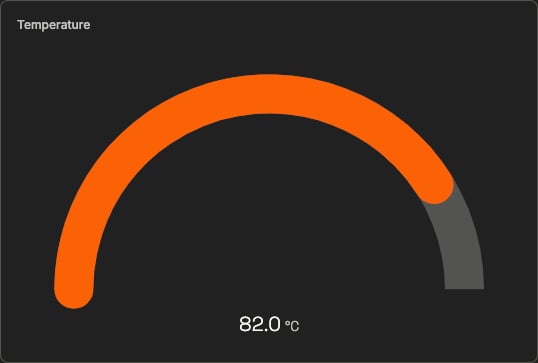
A radial gauge bound to a temperature topic, reading 82.0 °C
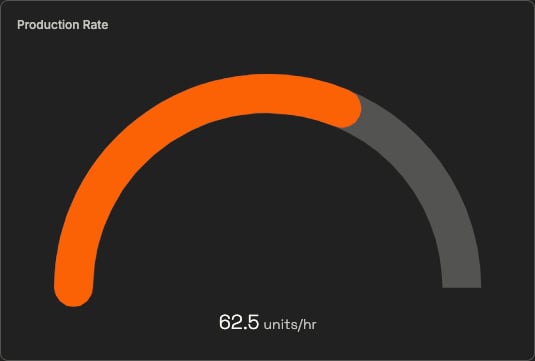
VALUE, MIN, MAX
Value
The simplest read-only display: a number or string, with unit and formatting.- Basic
- A JSON Data example
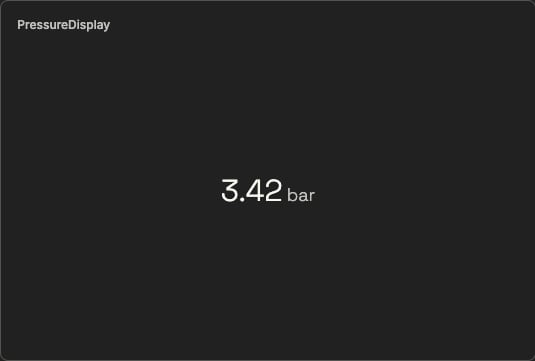
A numeric readout showing the live pump pressure in bar
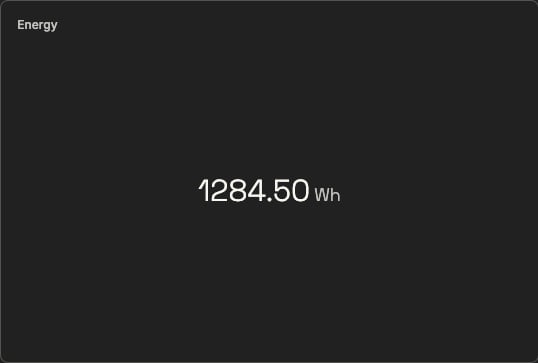
VALUE, MAX
JSON_PATH to pick the field — otherwise the widget shows the raw payload. Inspect the payload first in the Data Viewer.Text / Label
Dynamic or static text.label is an alias for text.
- Basic
- Full example

A static section heading rendered at large size

CONTENT, COLOR, TITLE, LABEL
Indicator
Maps incoming values to colors — running/stopped/fault at a glance.- Basic
- Full example
true:
A status dot that turns green while the pump-running topic reads true

STATE
Realtime Chart
Live streaming chart — it receives individual data points from a topic and builds the trend itself.- Basic
- Full example
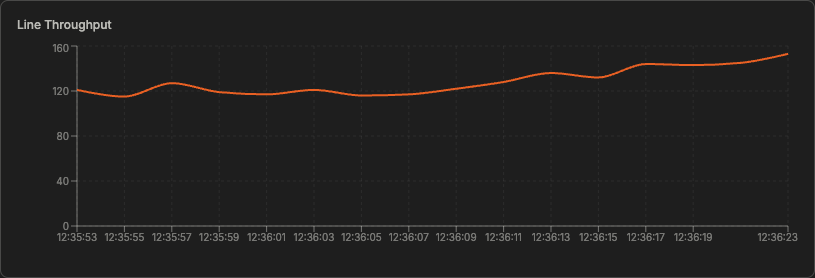
A realtime-chart building a live trend point by point from the throughput topic
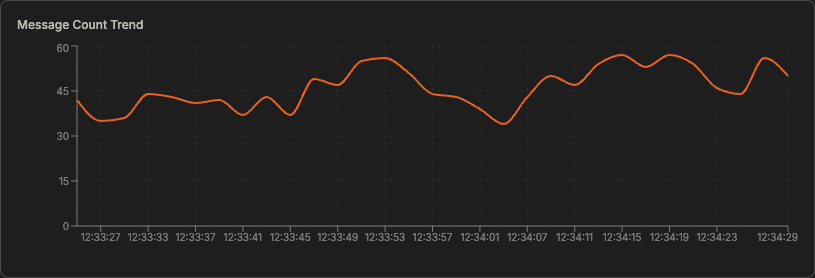
BIND VALUE TO TOPIC (each with its own indented SET SERIES_LABEL) is the documented syntax for multiple traces, but the chart currently renders a single trace and no legend. Use one chart per signal for now.VALUE
Image
Static, dynamic, or camera-fed image.- Basic
- Full example
An image component rendering a remote URL on the panel
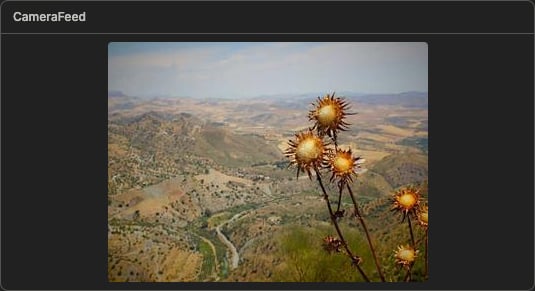
SRC, VISIBLE
Table
Tabular data from a JSON array topic or a query result.- Basic
COLUMNS picks and orders the fields: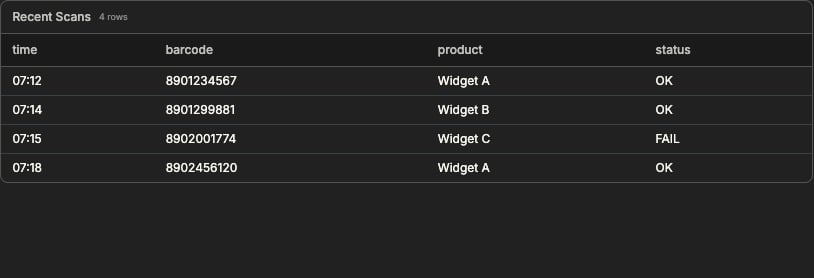
A four-column table populated from a JSON array topic
DATA
List
Scrollable list of items from a topic or model.- Basic
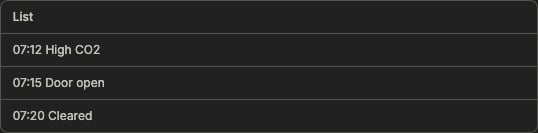
A scrollable list of alarm entries from a topic
DATA
Alert
Banner for critical messages — typically bound to an alarm flag.- Basic
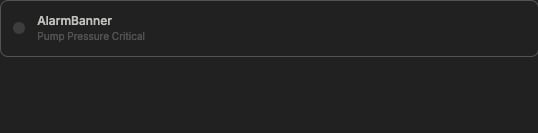
A banner that appears while the alarm flag is true and shows the live message
critical variant renders in a neutral/muted style rather than a strong red banner — the message and visibility behaviour work as shown.CONTENT, VISIBLE
Common mistakes
A property set with WITH is silently ignored
A property set with WITH is silently ignored
SET, never WITH. WITH UNIT "msg", WITH RANGE 0, 200, and WITH DECIMALS 2 are silently ignored — write SET UNIT "msg", SET RANGE FROM 0 TO 200, SET DECIMALS 2.The value widget shows a JSON blob instead of a number
The value widget shows a JSON blob instead of a number
SET JSON_PATH "$.field" to extract the field you want, and confirm the payload shape in the Data Viewer.