

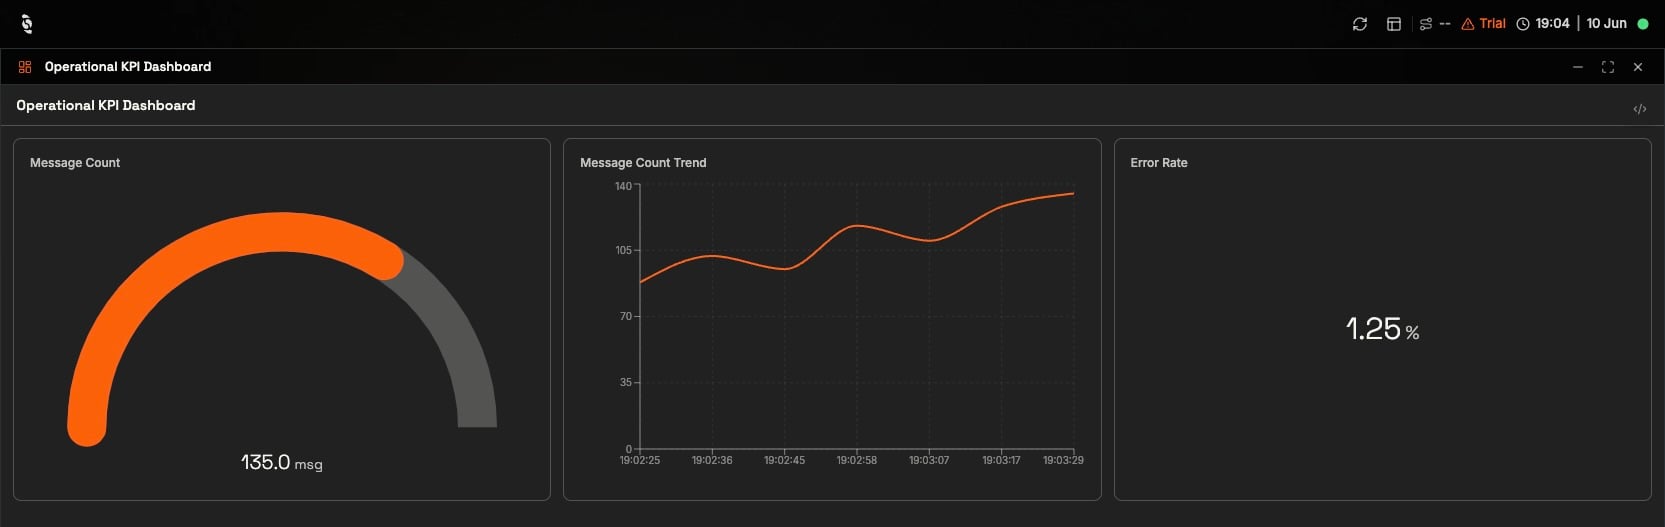
The Live KPI dashboard recipe from this page, running with live data
Five recipes, ordered from the smallest useful panel to data-layer integrations.
Minimal monitoring panel
Goal: one signal, one status — the smallest useful dashboard.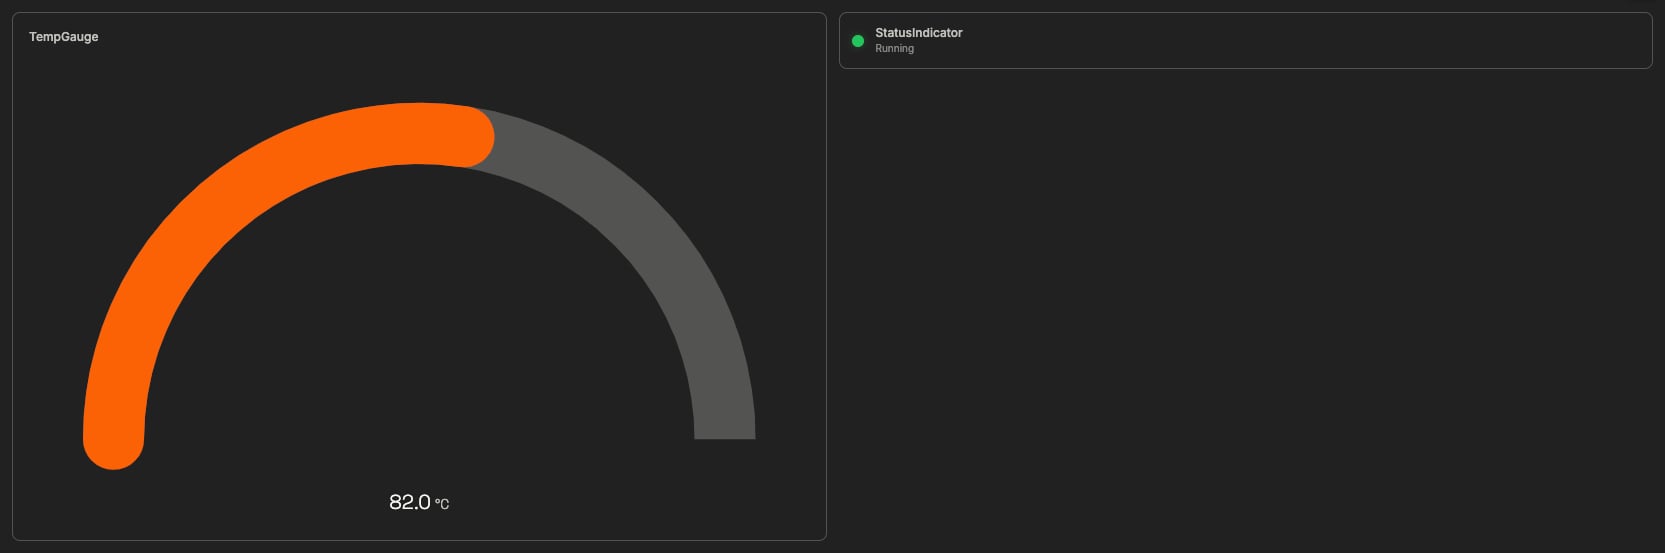
Two-column panel: a temperature gauge on the left, a running status indicator on the right
Live KPI dashboard
Goal: a wall screen with a headline number, its trend, and a secondary KPI.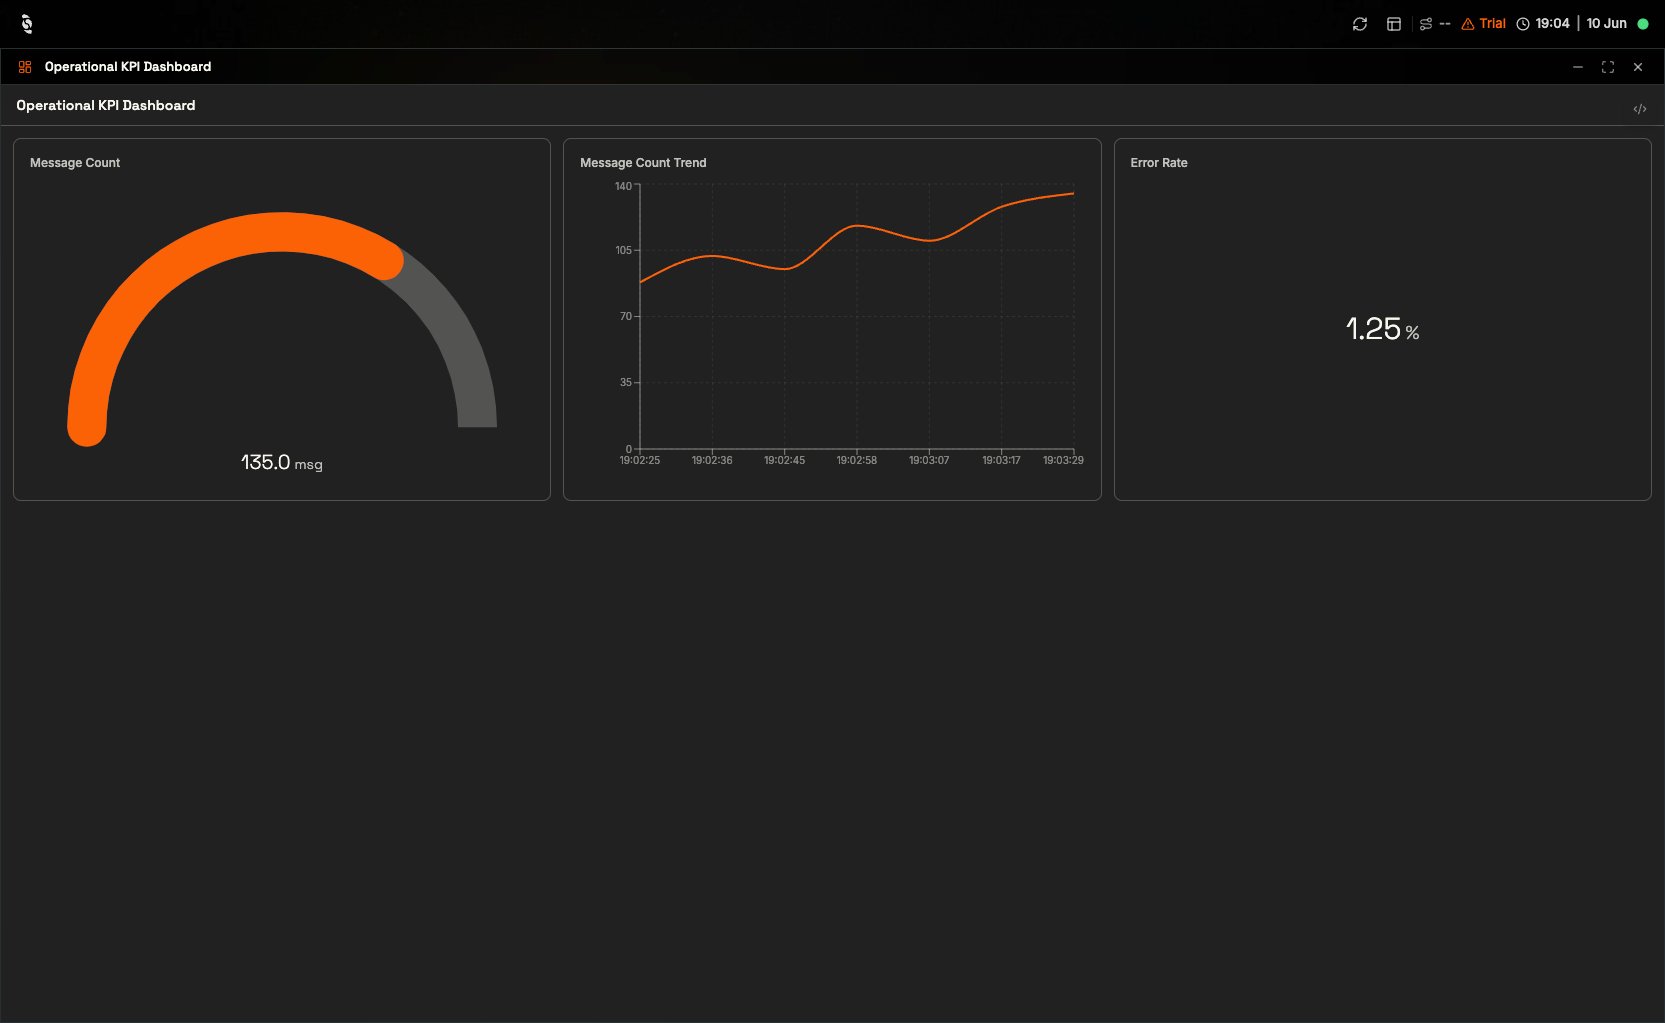
Three-column KPI wall: a message-count gauge, its live trend, and the error-rate readout
Control panel
Goal: drive the line from the dashboard — buttons publish commands, a number field sets the speed, and a slider tracks the live feedback.
Operator panel with start/stop buttons, a speed setpoint field, and a live conveyor speed slider
cmd/...) and the feedback topic (speed) — keeping them separate means the slider reflects what the line is actually doing, not just the last setpoint sent.
Panel backed by a LoT Model
Goal: when a Model already aggregates your data layer, bind to its fields instead of raw topics.Next Steps
Build your first dashboard
Walk through one of these panels end to end with live data.
Dashboards in the HUB
Publish, share, and put any of these on a wall screen.