

Overview
Debugging in LoT Notebooks means confirming data is moving on the right topics and your logic behaves as intended. The extension includes a Data Viewer and an Execution Trace tied to each LoT cell so you can see data, replay flows and inspect every related topic and variable.Data Viewer
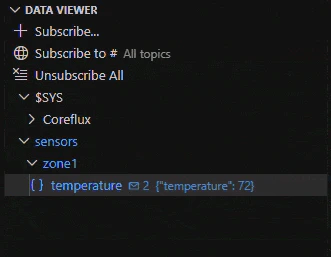
Topic Tree Viewer
Replay Data Viewer
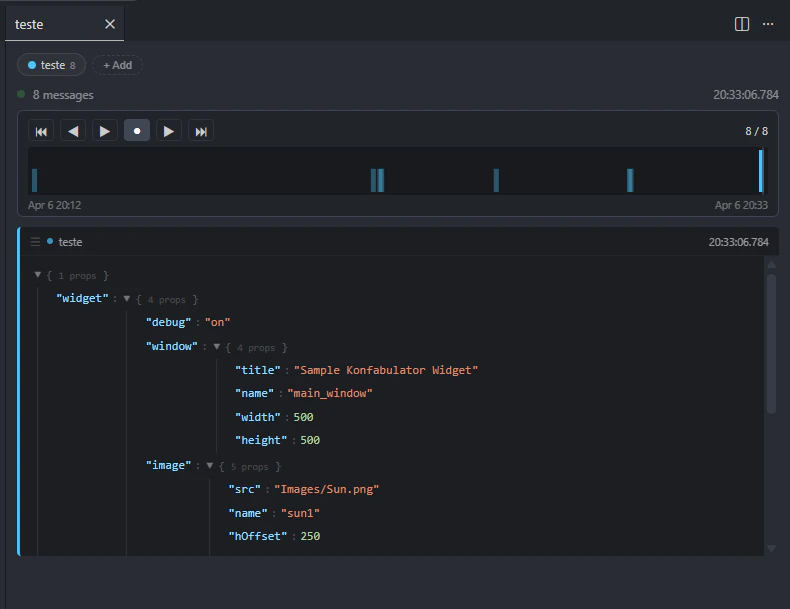
- Message history and a multi-topic layout so you can follow several related topics at once
- Replay controls to move through captured messages over time
- A data formatter so you can interpret payloads the way they were meant to be read—pick the view that matches how the payload is encoded
Adjust how you see the data
Choose a formatter after opening a topic. The full viewer supports multiple topics, a message history, replay (timeline and playback controls), and data views such as raw, JSON, Protobuf, geopoint, image, audio and PDF.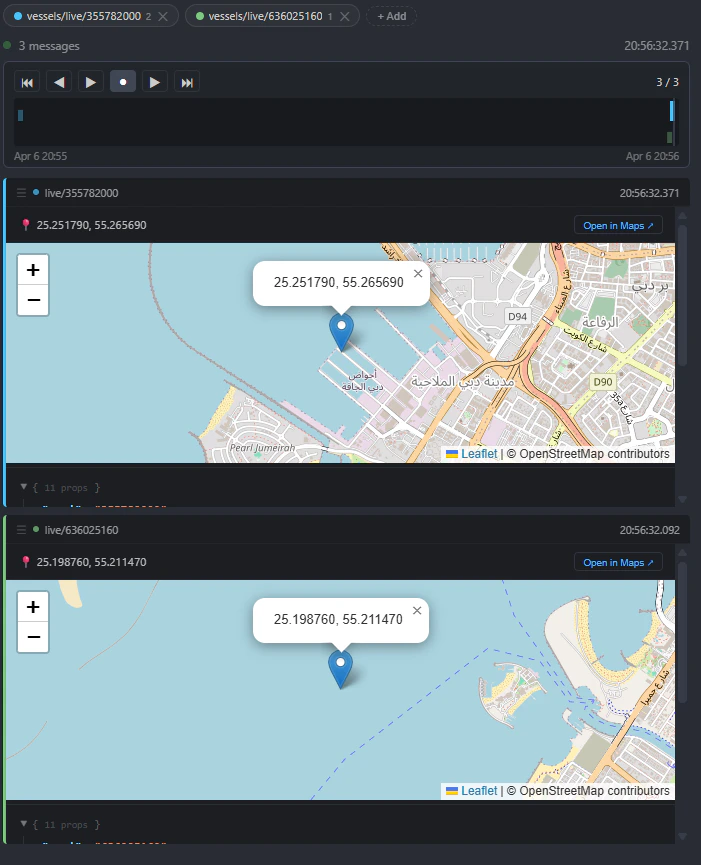
Execution trace
Troubleshooting
When the viewer or trace does not match what you expect, open the sections below.Broker connection issues
Broker connection issues
If cells fail immediately or never show a response, verify credentials and network first.
- Open the Command Palette (
Ctrl+Shift+PorCmd+Shift+P) or use the connection control in the activity bar / status area as shown in your setup. - Run LoT Notebook: Change Credentials and enter your broker URL, username, and password.
- Watch the status bar for a connected state before running cells.
- Default credentials and TLS notes: LoT Notebooks setup guide
- Confirm the broker is reachable (host, port, firewall, TLS if using
mqtts://)
Cell run output and errors
Cell run output and errors
When you click Run on a LoT cell, the extension sends the definition to the broker and shows the result directly below the cell.
| What you see | What it means |
|---|---|
| Success message / green check | The broker compiled and registered the entity (Action, Model, Route, or Rule). |
| Error text | Often syntax, indentation, or broker-side validation—read the full message for line hints when provided. |
Related guides
How to Use a LoT Notebook
Cell execution, commands, broker topics, and troubleshooting accordions.
Introduction to LoT
What LoT is, how it runs in the broker, and simple examples to build on.