

Documentation Index
Fetch the complete documentation index at: https://docs.coreflux.org/llms.txt
Use this file to discover all available pages before exploring further.
Why Use Dashboards?
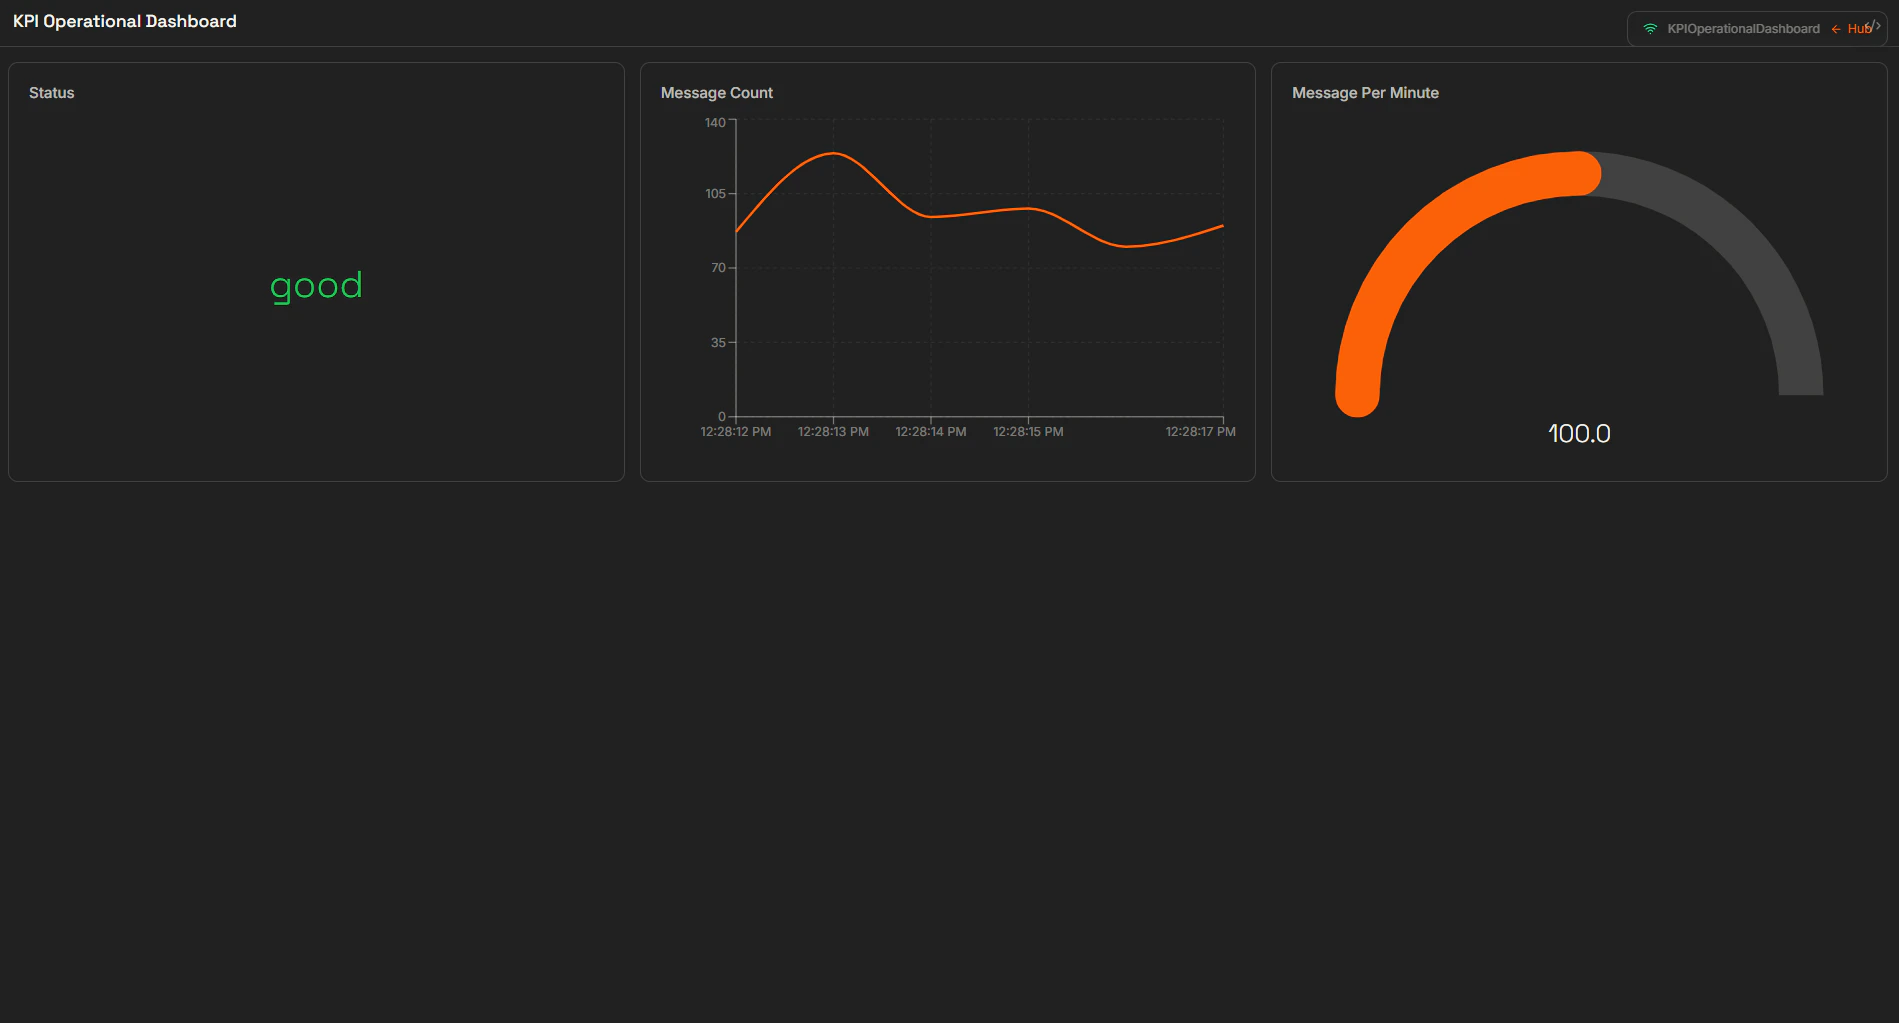
Every site and team asks different questions. Instead of commissioning a one-off HMI for each role, you can assemble the exact screen each person needs—KPI wall, line overview, or machine detail—and keep it live from data flowing through your broker. Dashboards in the Coreflux HUB update as soon as the underlying values change, without a separate deploy step or refresh ritual.When to Use Dashboards
- KPI walls — Large readouts and trends for supervisors and management
- Line and area overviews — At-a-glance status for a process or zone
- Machine detail — Gauges, symbols, and controls for a single asset
- Operator stations — Forms, buttons, and setpoints where people work the process
- Shift or mobile views — Simplified layouts for tablets and shared screens
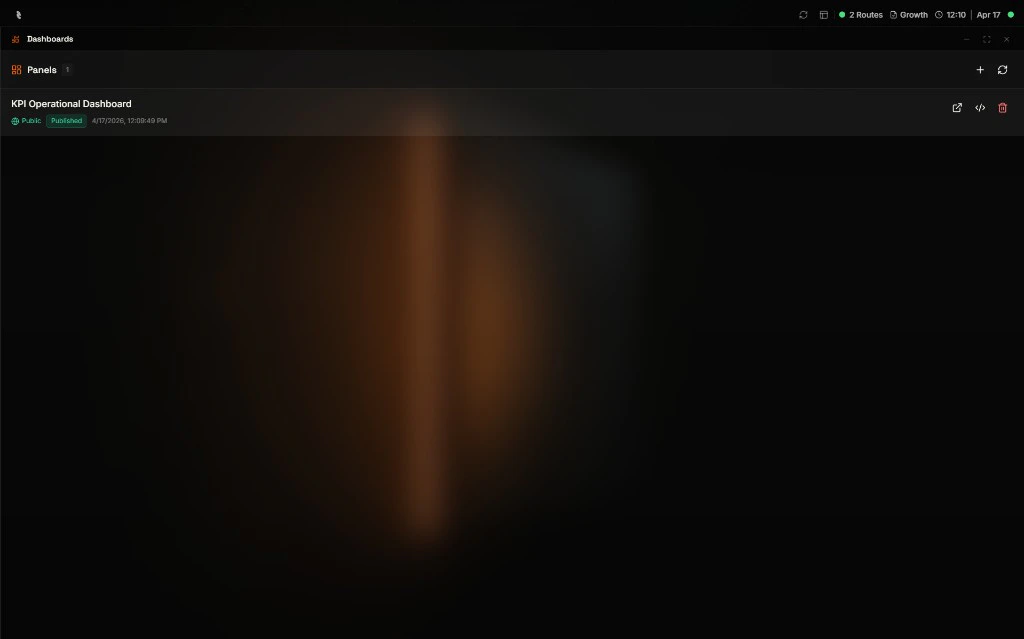
Opening the Dashboard Manager
The Dashboard Manager is an app inside the Coreflux HUB. It lists your panels (each panel is one dashboard you can open, share, or refine). From here you add panels, refresh the list, and open a panel to see it live.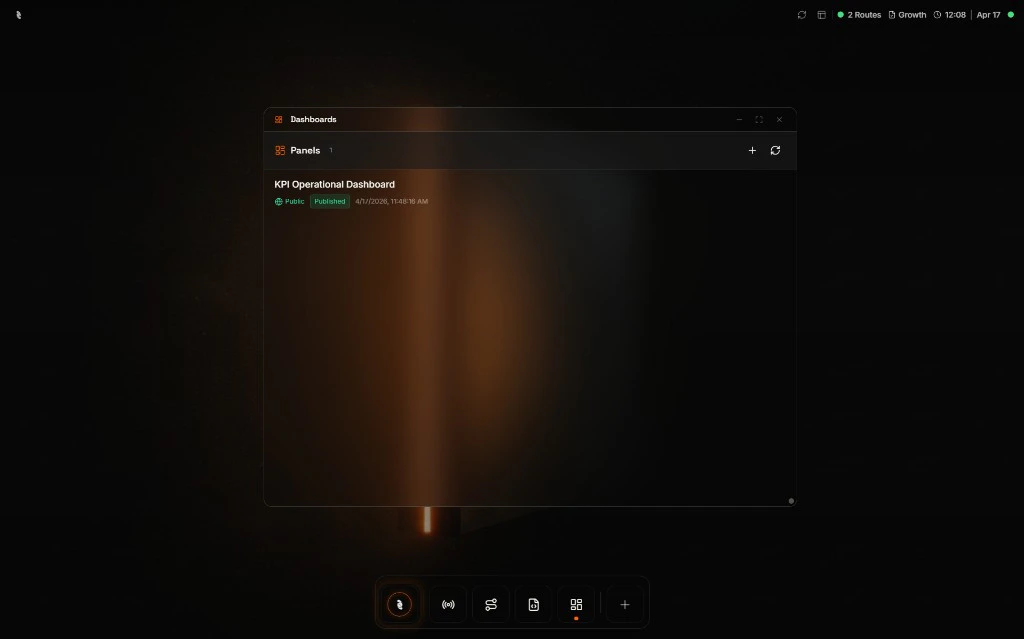
What You Can Display
Panels are built from a library of components. You drag them onto the canvas and tune labels, ranges, colors, and thresholds—no coding required.| Category | Examples |
|---|---|
| Readouts | Gauges, large numbers with units, text lines, on/off/fault indicators, wall-sized KPI numerals |
| Charts | Line charts for trends, bar charts for comparisons, progress bars |
| Industrial symbols | Pumps, valves, tanks with live fill, motors, instruments |
| Controls | Buttons, toggles, sliders, text and number fields, forms that send values back when the operator confirms |
| Media | Cameras, video, images, audio, custom mimic drawings |
| Identification | Barcode and QR displays, scanner widgets |
| Maps and tables | Geo maps, live tables, lists, dropdowns fed from data |
| Layout and alerts | Section labels and banners when a condition is true |
How data updates on a Dashboard
Each component is tied to live data on your broker—typically a topic that already carries the signal from your machines, databases, or Routes. When that topic’s value changes, the widget updates. You do not configure polling or manual refresh for normal operation.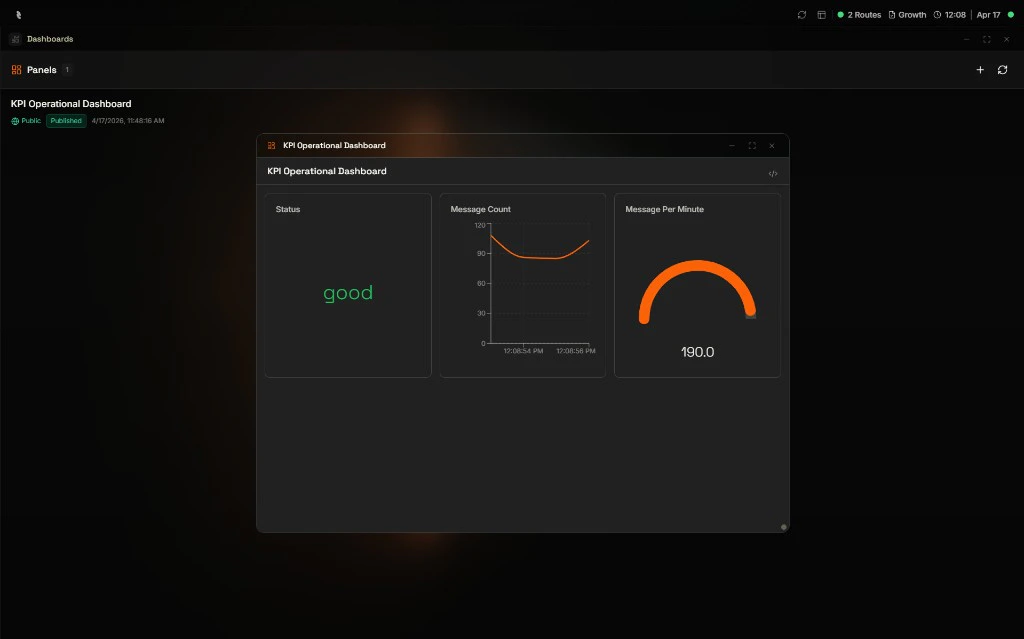
Viewing a Panel
You can experience the same panel in more than one layout depending on where you need it.- As a window
- Full screen
Open the panel as a floating window on top of the HUB. That keeps the rest of the HUB—routes, Data Viewer, configuration—one click away while you watch live values or try layout changes.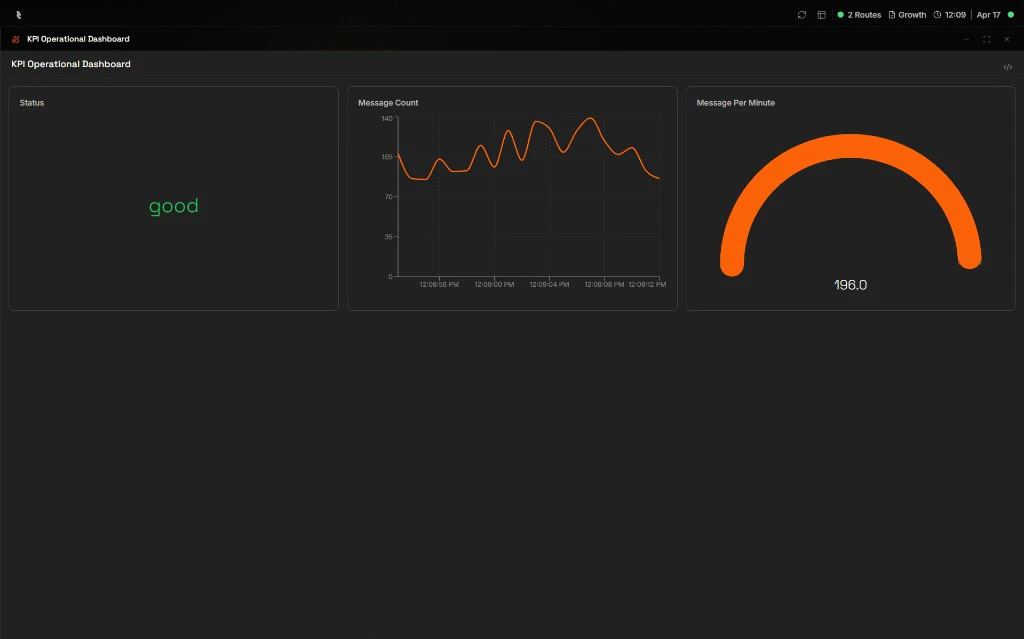
Managing Panels
Each row in the panel list shows the panel name, a visibility hint (for example Public), its publication state (for example Published), and when it was last updated. Clicking the row itself opens the panel; hovering reveals a row of quick actions on the right for sharing, inspecting, and deleting.| Action | How to trigger it | What it does |
|---|---|---|
| Open as a window | Click the panel row | Opens the panel as a floating window on top of the HUB so you can keep working while it stays live |
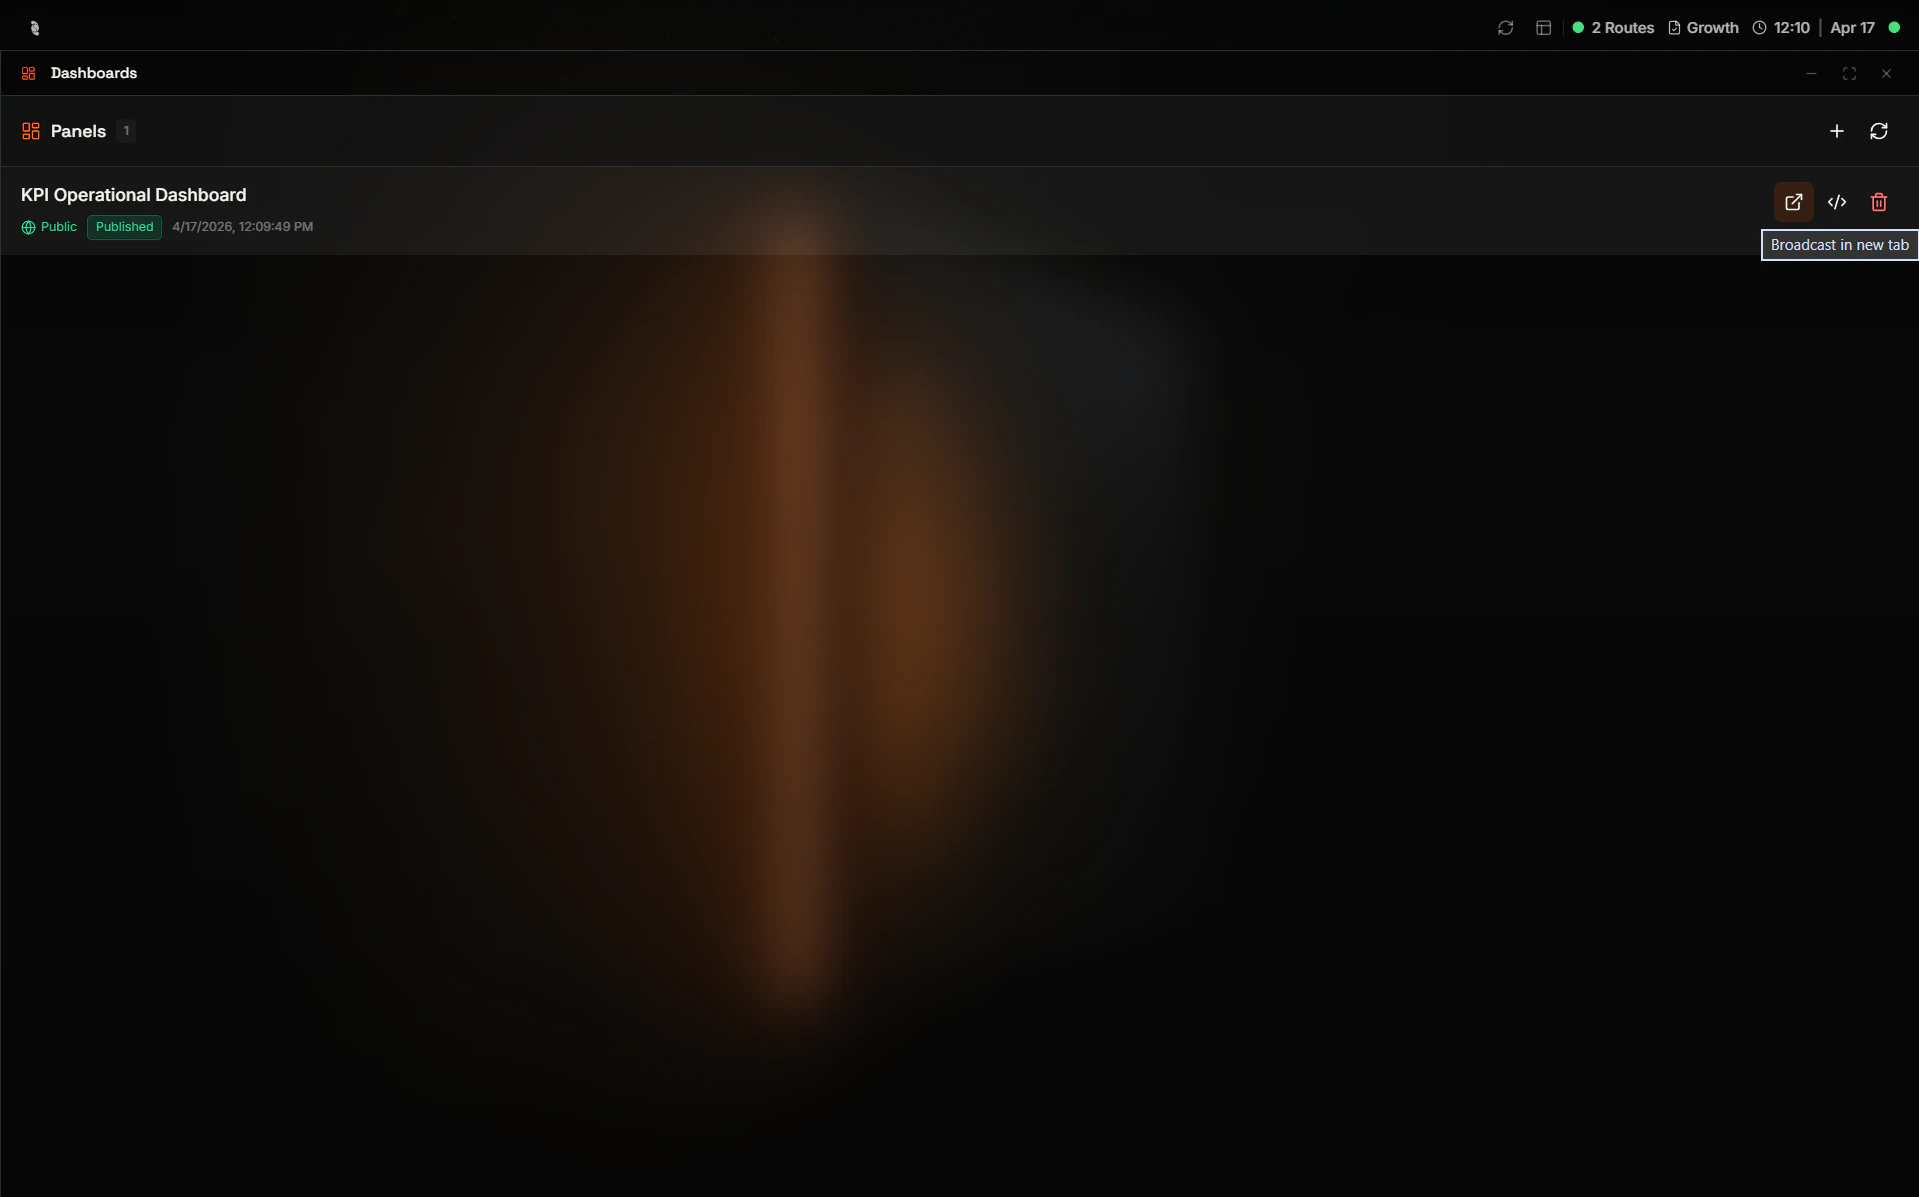
| Open as a link | Click the first icon on the right (external link) | Opens the panel in a dedicated shareable view—useful for plant displays, wall screens, or sending a URL to a teammate |
| View source | Click the second icon on the right (code) | Shows the panel’s underlying definition so you can inspect or copy it |
| Delete dashboard | Click the last icon on the right (trash) | Removes the panel from the list after confirmation |
Sharing Panels on TVs and External Displays
You can put the same live panel on any screen that runs a browser—control-room wall TVs, lobby KPI boards, shop-floor tablets, or a monitor at a remote site—without installing a separate HMI app or giving everyone full access to the Coreflux HUB. The shareable panel URL opens a dedicated view of that dashboard so viewers see only the panel, not routes, configuration, or other HUB apps. From the Dashboard Manager, hover the panel row and click the external link icon (first action on the right). That opens the panel in a dedicated tab or window; copy the URL from the address bar and paste it into a browser on a TV stick, kiosk PC, tablet, or any display you want to keep on the loop. Typical uses:- Control-room and plant walls — Full-screen dashboards that stay readable from a distance
- Lobby and office KPI screens — Management views without exposing operator tools
- Shop-floor tablets — Lightweight devices that only need one panel
- Stakeholders and contractors — A single URL when someone needs read-only visibility, subject to the panel’s Visibility settings
Visibility and Lifecycle
Every panel carries two simple dimensions: who can open it, and whether it is ready for daily use.| Dimension | Options | Meaning |
|---|---|---|
| Visibility | Public · Shared · Private | Who is allowed to open the panel |
| State | Draft · Published · Archived | Draft while you are still building; Published when operators should rely on it; Archived when you want to retire it without losing the work |
Best Practices
Name panels by audience
Name panels by audience
Use names that tell you who it is for (for example “Line 3 — Shift Lead”) so the list stays scannable.
Start small
Start small
Ship a minimal panel with the three signals people ask for most, then add depth once it is in daily use.
Match symbols to reality
Match symbols to reality
Use pumps, valves, and tanks where operators already think in those terms; use charts where trends matter more than mimic layout.
Publish deliberately
Publish deliberately
Keep work-in-progress in Draft until labels, ranges, and safety-related controls are verified.
Next Steps
Data Viewer
Browse topics and payloads so you know what to bind each widget to.
AI Assistant
Ask the assistant to suggest layouts, bindings, or improvements to a panel.