

Documentation Index
Fetch the complete documentation index at: https://docs.coreflux.org/llms.txt
Use this file to discover all available pages before exploring further.
Manage Your Broker from the Browser
You have a Coreflux broker running. Now you want to explore MQTT topics, deploy LoT code, configure routes, and manage users — all without installing desktop tools or memorizing command-line syntax. The Coreflux HUB gives you a browser-based interface that puts every management task in one place.When to Use This
- You want to manage your broker visually without installing MQTT Explorer or VS Code
- You need to deploy and test LoT code quickly from any machine with a browser
- You’re configuring routes to databases or PLCs and want a guided, visual workflow
- You want to monitor connected clients and system health in real time
Access the HUB
Open your browser and navigate to:| Environment | URL |
|---|---|
| Local | http://localhost:8080 |
| Remote | http://<broker-ip>:8080 |
| HTTPS | https://localhost:8443 |
| Setting | Value |
|---|---|
| Username | root |
| Password | coreflux |
What Can You Do with Coreflux HUB?
Once you’re logged in, the HUB gives you four dedicated apps that together cover every broker management task — from inspecting live data to deploying logic and connecting external systems.MQTT
Browse live topics, inspect payloads, publish test messages, and see which clients are connected.
LoT Editor
Create, edit, and deploy Actions, Models, and Rules directly in the browser — no external tools needed.
Routes
Connect your broker to databases, PLCs, and external systems using templates or LoT code, then monitor each connection in real time.
System
Configure the broker, manage users and permissions, run commands, and stream real-time logs for diagnostics.
| Task | HUB App |
|---|---|
| Browse topics and inspect message payloads | MQTT |
| Publish a test message to any topic | MQTT |
| See which devices are connected | MQTT |
| Write or update an Action, Model, or Rule | LoT Editor |
| Deploy LoT code to the broker instantly | LoT Editor |
| Add a route to a database or PLC | Routes |
| Monitor route connection health and logs | Routes |
| Change broker network or TLS settings | System |
| Create users and assign permissions | System |
| View real-time broker logs and run commands | System |
| Ask for insights, build dashboards, or draft LoT from plain language | AI Assistant |
See Your MQTT Data
Open the MQTT app to browse every topic flowing through your broker in real time. The topic tree on the left lets you drill into any hierarchy, and selecting a topic shows its latest payload, QoS, and timestamp on the right.
Connect to an External Device with a Route
Open the Routes app to connect your broker to databases, PLCs, or other external systems. Pick a template, fill in the connection details, map MQTT topics to fields, and activate — the HUB handles the rest.
Quickly Change the LoT Running on the Broker
Open the LoT Editor to create, edit, or redeploy Actions, Models, and Rules directly in the browser. Changes take effect immediately — no build step, no file transfer, no restart.
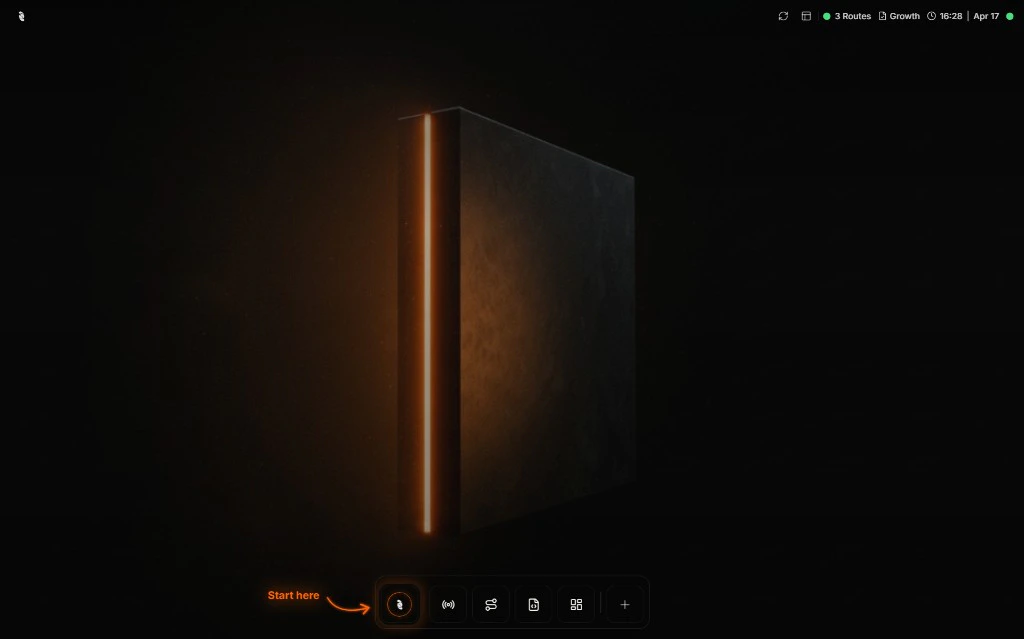
Build With the AI Assistant
Open the AI Assistant from the Coreflux icon in the bottom dock and describe what you want in plain language — ask for insights from live data, build a dashboard with live widgets, or develop a LoT Action. The assistant uses the broker’s own tools to draft, refine, and deploy the change in the same panel.
Debug Your LoT and Broker
Open the System app when something isn’t behaving as expected. Broker Logs stream trace-level output in real time, and the Command Console lets you run broker commands directly — restart actions, inspect state, or change configuration on the fly.
Next Steps
Explore the HUB
Deep-dive into each app — Data Viewer, LoT Editor, Routes, and System tools.
Create Your First Action
Build and deploy a working LoT Action in under 15 minutes.