


Coreflux HUB home screen with the app dock and live status (routes, workspace, time)
Why Use the Coreflux HUB?
You need a single place to manage your broker without installing extra tools or connecting via the command line. The Coreflux HUB gives you an interface to explore topics, create and edit LoT (Language of Things) definitions, configure routes, and monitor system status—all from one dashboard. It is available as a browser app (its own container, via Docker Compose) or as a standalone desktop application for Windows and Linux.The Coreflux HUB is a separate container from the broker — it is not bundled in the broker image. Run it with Docker or Docker Compose (open
http://localhost:3000) or as a standalone desktop application for Windows x64, Linux x64, and Linux ARM64. See Installation for Docker commands, Compose profiles, the HUB desktop app, and the login flow.When to Use the HUB
- Manage everything from the HUB — Configure your broker, deploy logic, and set up data routes without installing desktop tools
- Go from idea to deployment in minutes — Write and deploy Actions, Models, and Rules directly in the built-in editor
- Monitor your system in real time — See device connections, data flow, and system health at a glance
- Diagnose issues fast — Inspect live MQTT messages and run broker commands from one interface
Prerequisites
Install the HUB (and the broker, if you do not already have one) from Installation. Afterdocker compose --profile full up, open http://localhost:3000, click New Connection, and set Host to broker (Protocol mqtt://, Port 1883). The desktop app is on the HUB desktop tab of that page.
How the HUB Is Organized
The HUB is built around five apps. Each app groups related tools so you can switch between tasks without leaving the browser.MQTT
Explore topics, publish messages, and view connected clients.
LoT Editor
Create and edit Actions, Models, and Rules in the browser.
Dashboards
Build live panels with gauges, charts, and controls bound to broker data.
Routes
Add, configure, and monitor routes with templates or LoT code.
System
Broker configuration, user management, trace logs, and command console.
MQTT
Browse live data flowing through your broker. The MQTT app includes a Data Viewer for subscribing to topics and publishing test messages, and a Connected Clients view to see which devices are online.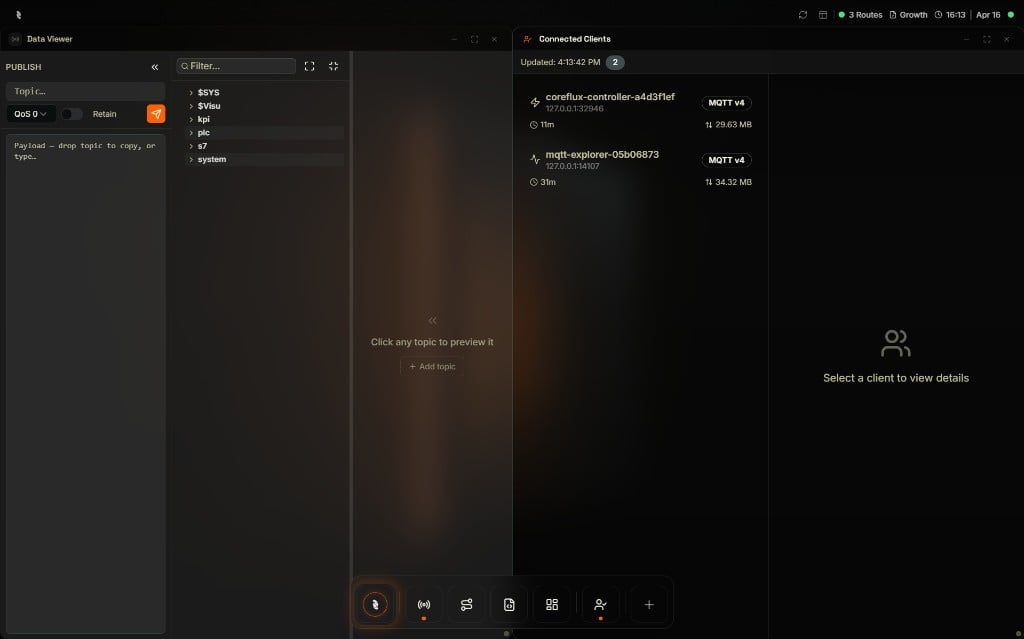
MQTT app — Data Viewer with topic tree and publish controls, plus Connected Clients
LoT Editor
Write and deploy logic directly in the HUB. The LoT Editor is a notebook editor: cells hold LoT, Python, or Markdown, each cell deploys on its own, and the sidebar lists everything currently running on the broker — no external tools required.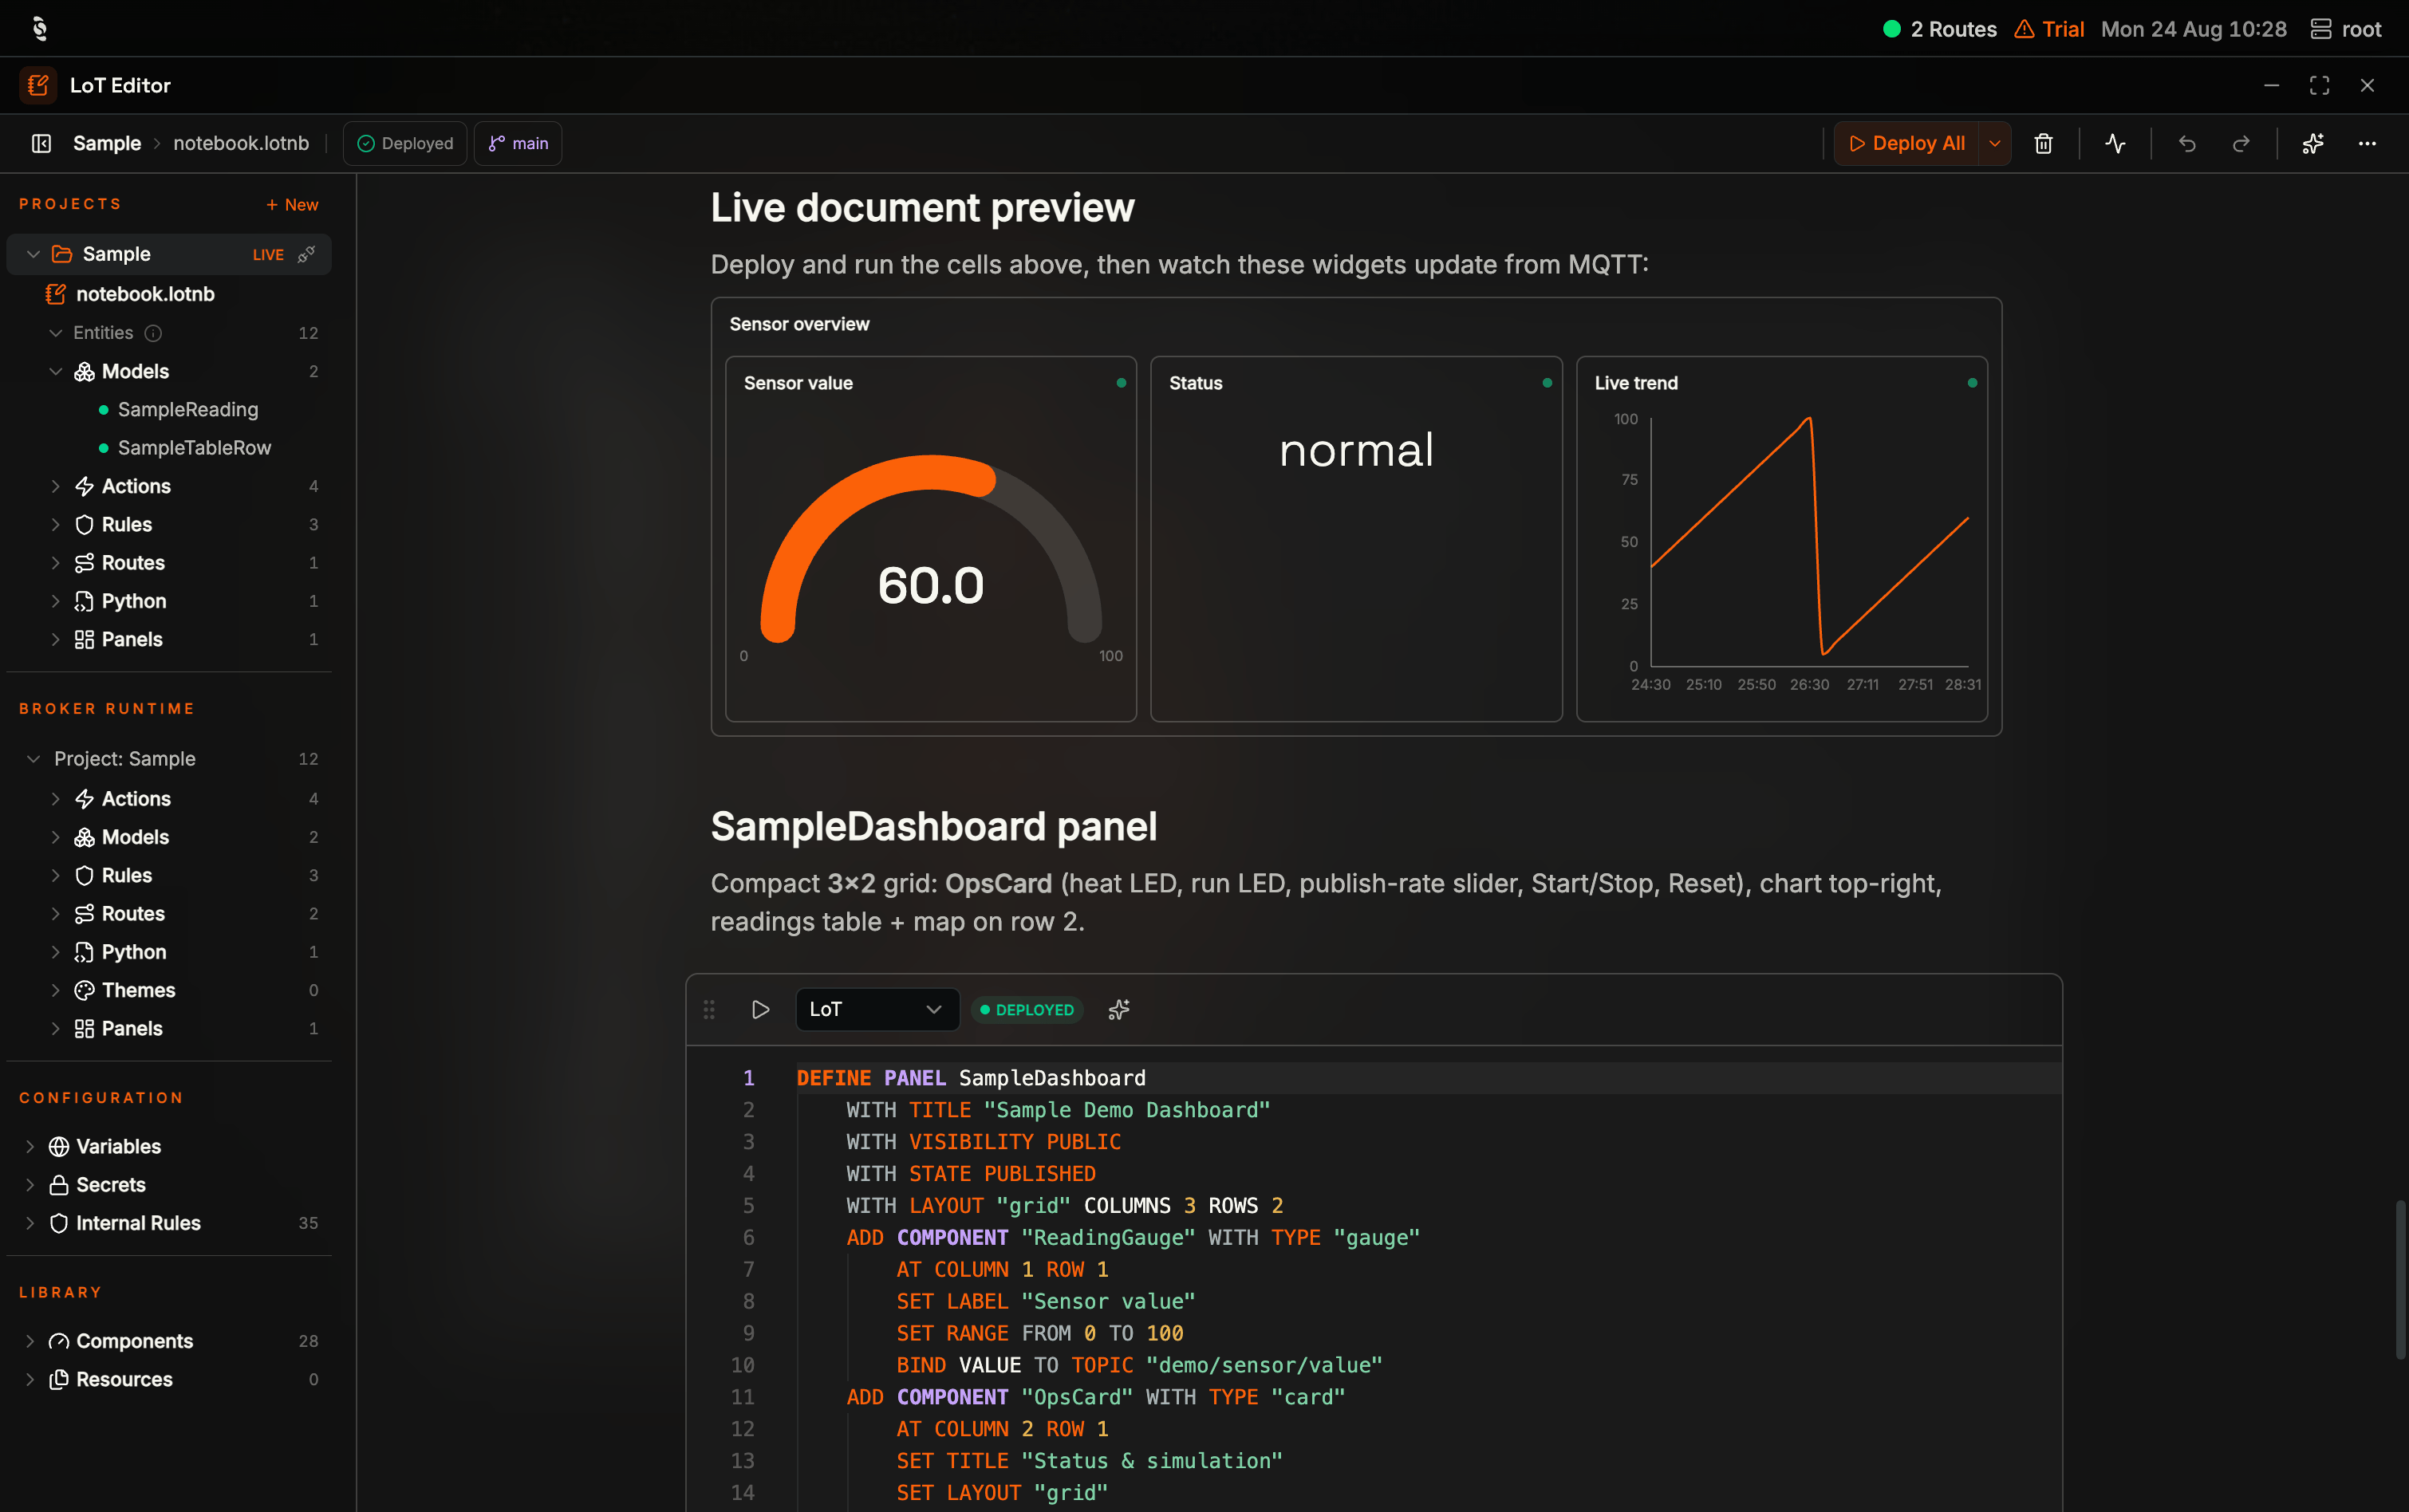
LoT Editor — Sample LIVE in Projects, Project: Sample in Broker runtime, a live document preview, and Deploy All
Dashboards
Design operator-facing screens from a component library—gauges, charts, industrial symbols, and controls—and bind each widget to live data on your broker. The Dashboard Manager lists your panels; open one to preview or use it full screen for walls and shared links.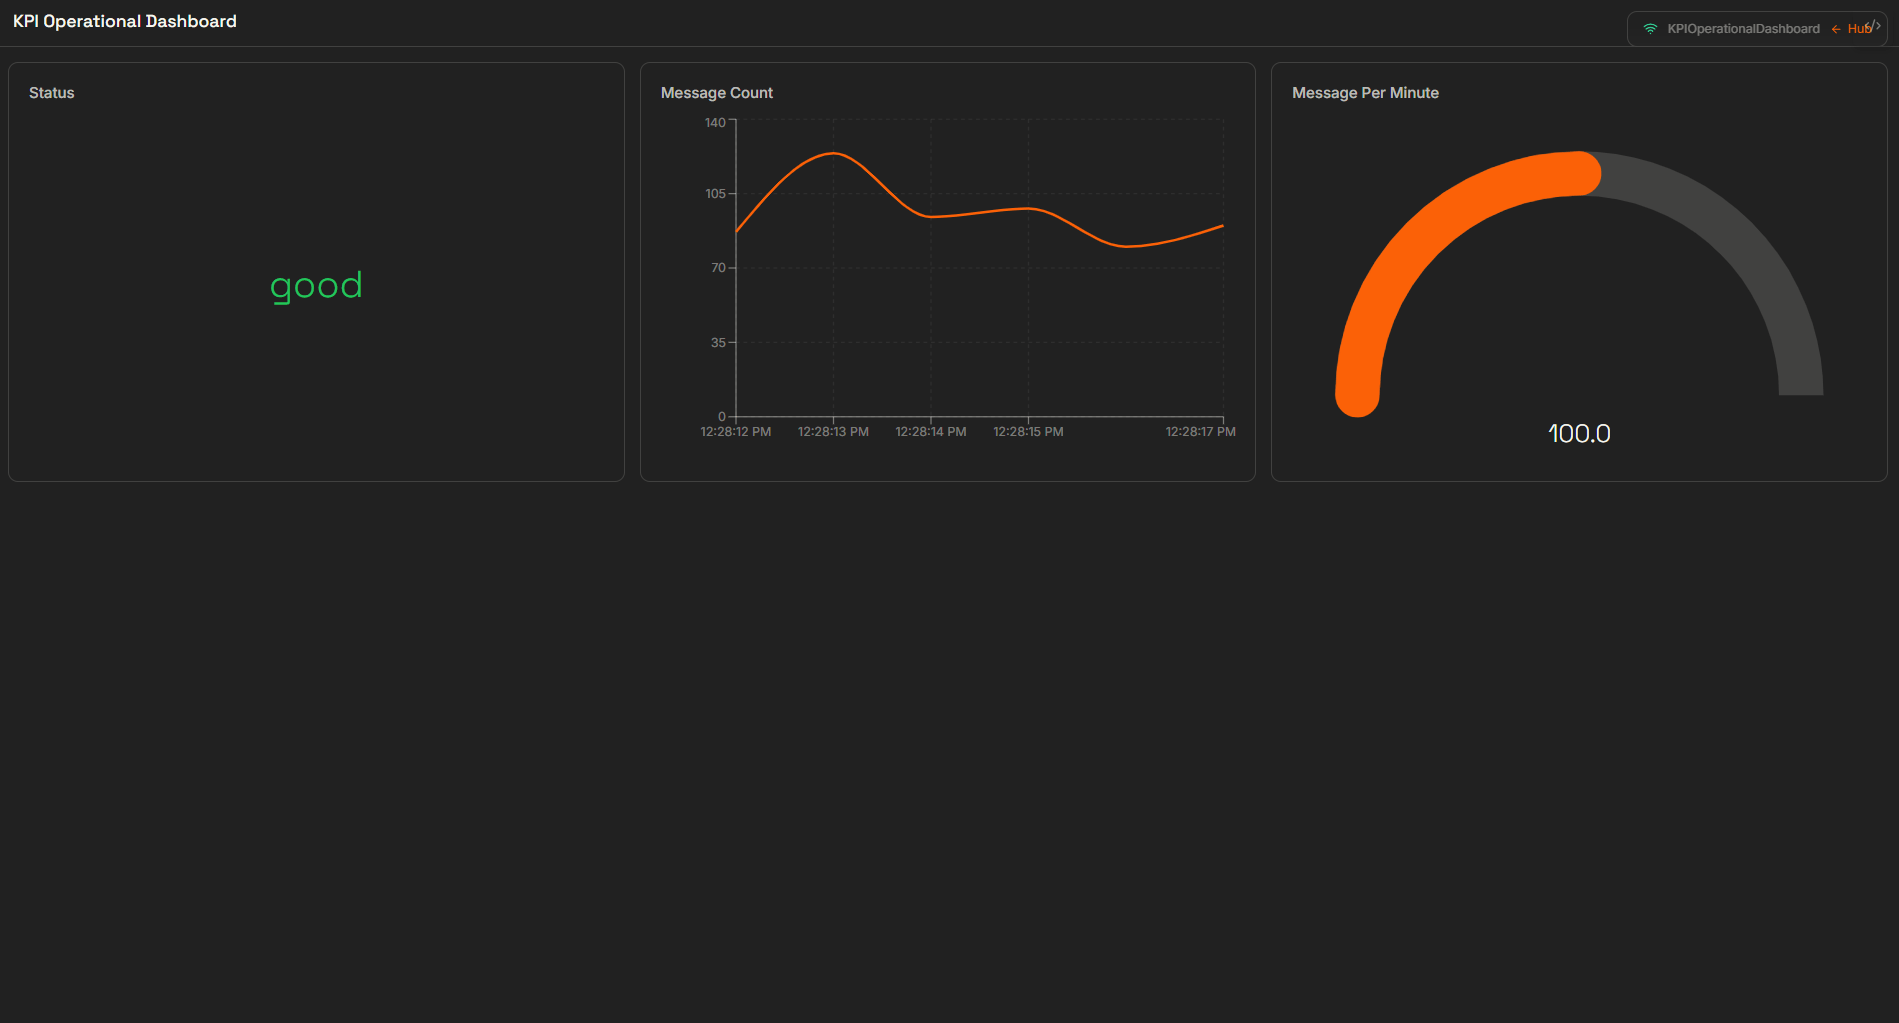
Dashboards — published panel with live numeric readout and gauge
Routes
Connect your broker to databases, PLCs, and external systems. The Routes app shows each route as a card with a live status indicator, and lets you configure routes visually or in LoT code.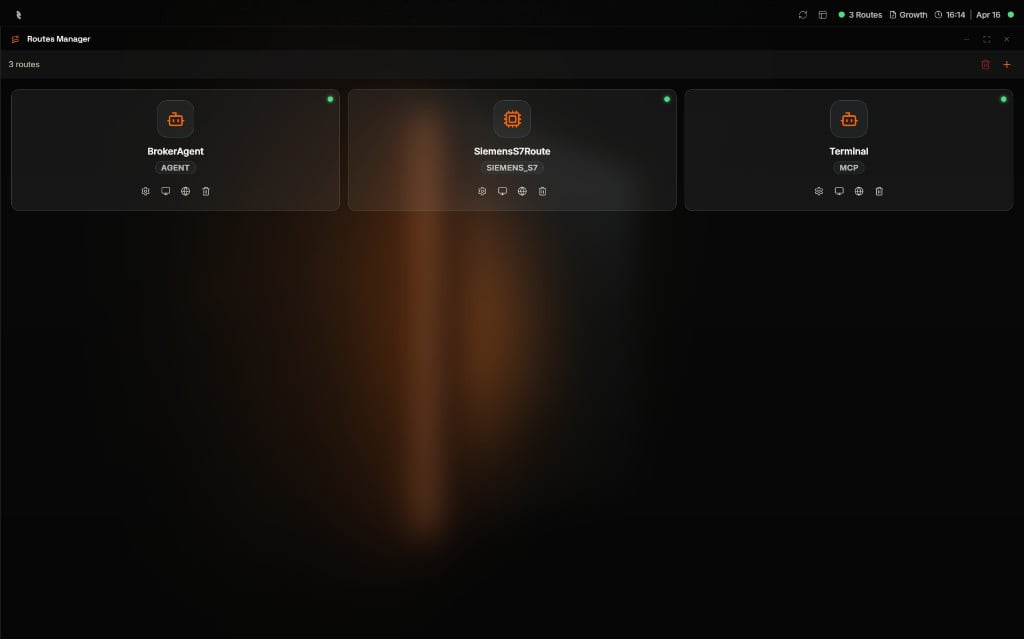
Routes app — route cards with live status and quick actions on each card
System
Administer the broker itself. The System app provides Broker Configuration, User Management, a Command Console for direct broker commands, and Broker Logs for real-time diagnostics.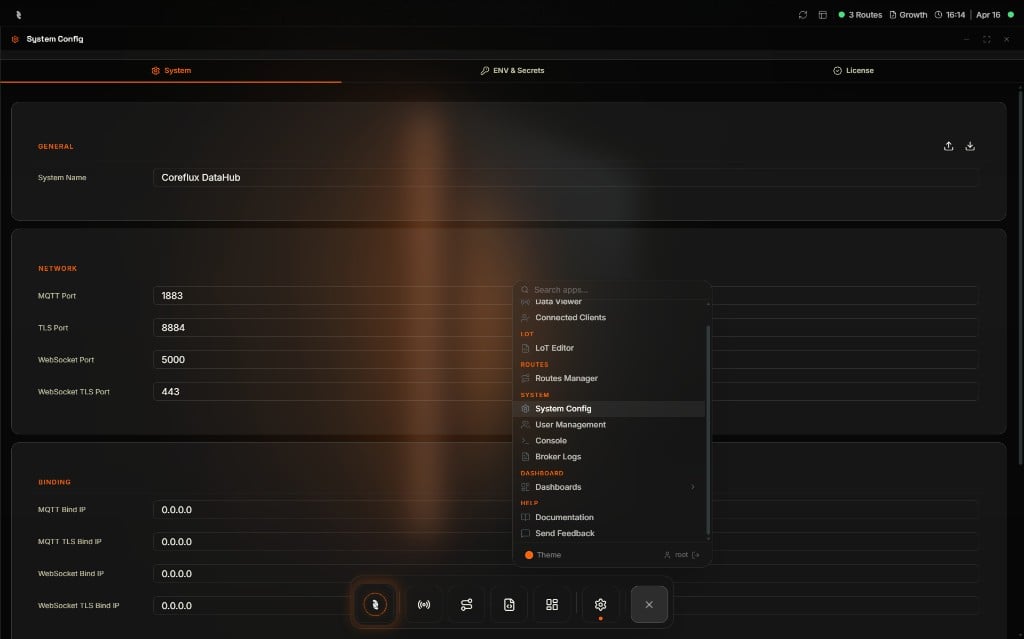
System app — System Config with network settings and the app launcher menu open
Next Steps
Installation
Run the HUB with Docker, Compose, or the desktop app — then connect from New Connection.
Connections Manager
Save multiple brokers, secure them with TLS, and switch between them.
Data Viewer
Subscribe to topics and publish messages from the browser.