

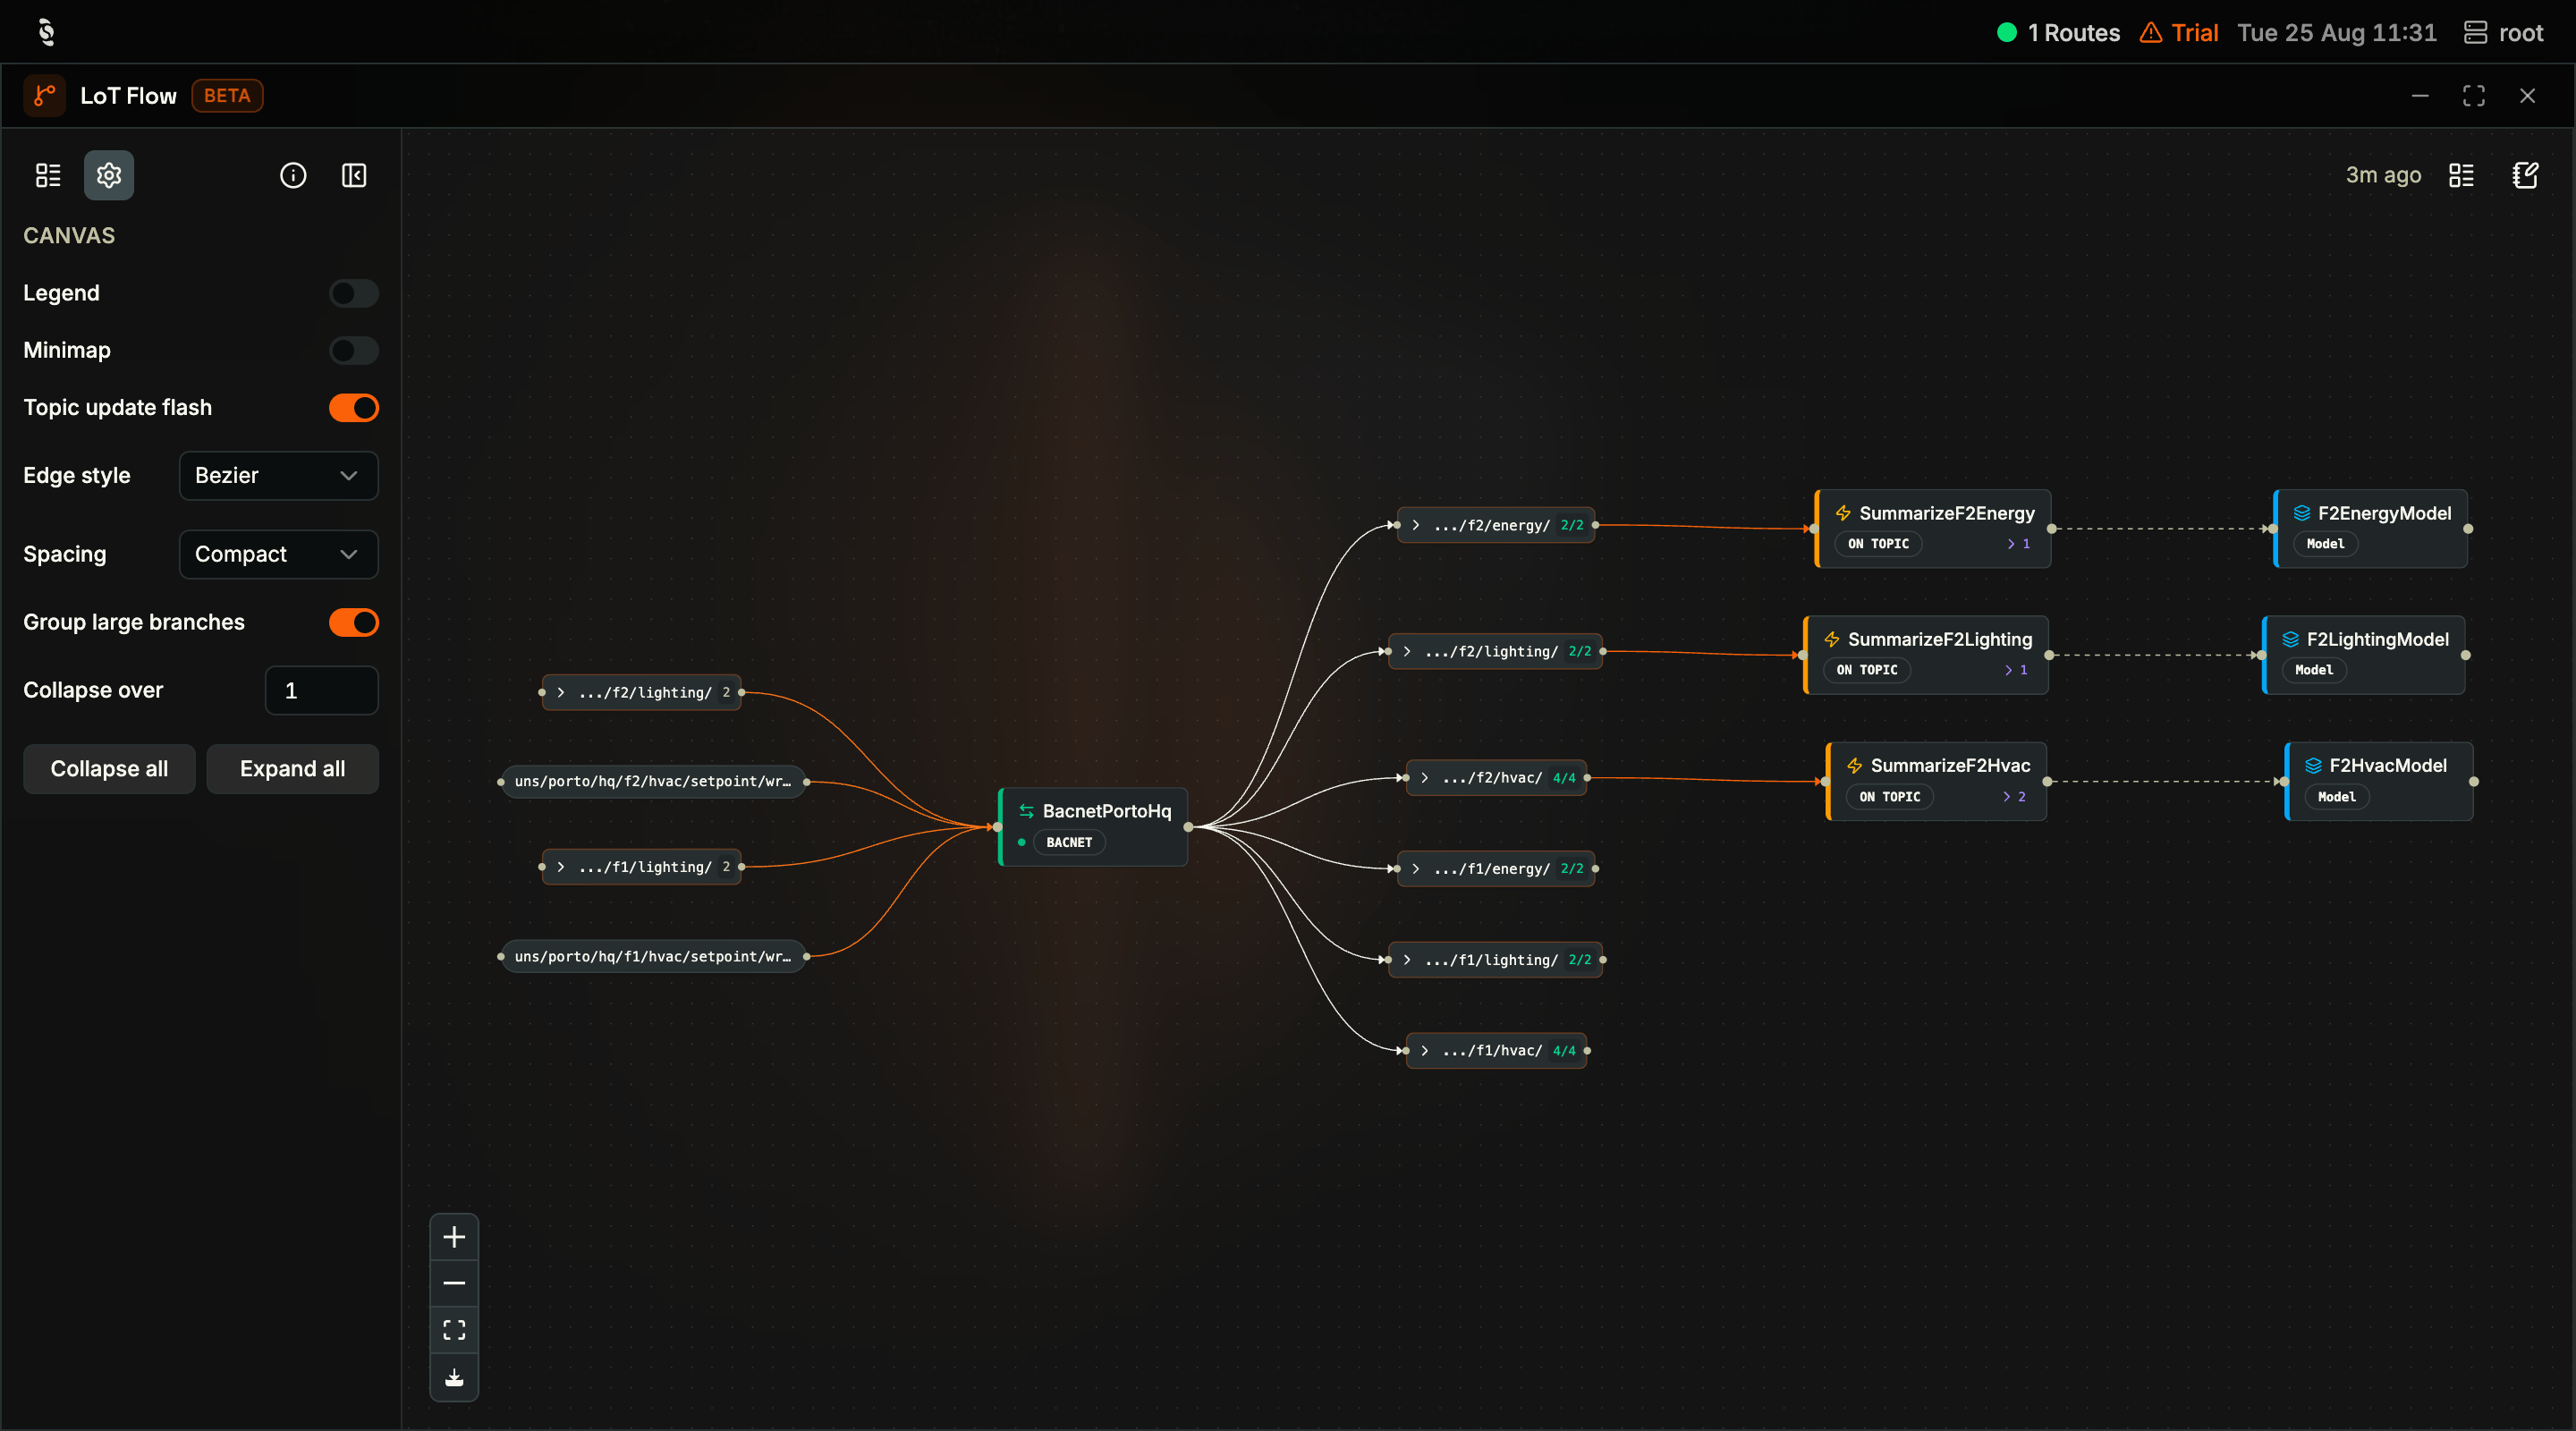
LoT Flow with Settings open: Group large branches on and Collapse over set to 1, so sibling topics fold into prefix groups such as …/f2/hvac/ 4/4. The BacnetPortoHq route sits in the middle, three ON TOPIC Actions feed F2EnergyModel, F2LightingModel, and F2HvacModel, and Reset layout is the list icon in the canvas top-right
Why Use LoT Flow?
Once you have more than a handful of Actions, Models, and Routes on a broker, the question “what happens when this topic changes?” stops having an obvious answer. Tracing it means opening each definition and following topic names by hand. LoT Flow reads the LoT entities deployed on your broker and draws how they connect — what triggers what, and which topics each one reads and writes — so you can follow the data flow instead of reconstructing it from source.LoT Flow carries a
Beta badge in its window header. It is available for everyday use, but its controls and layout may still change between releases.When to Use It
- Understanding an inherited project — See the whole entity graph before changing any of it
- Answering “what does this topic affect?” — Follow trigger edges from a topic to the Actions it fires
- Confirming a deployment — Check that a newly deployed Action appears, and that it is wired to the topics you intended
- Finding orphans — Spot entities that nothing triggers and topics that nothing consumes
- Reviewing an integration — See which topics a Route publishes into your namespace and which it writes back out
- Debugging execution order — Follow trigger and event edges to understand what runs before what
LoT Flow Reads the Broker, Not Your Workspace
This is the single most important thing to know about LoT Flow: the graph is built entirely from entities deployed on the connected broker. The LoT Editor’s sidebar is split into two halves that are easy to conflate:
A notebook cell you have written but not yet deployed is marked
NOT RUNNING in the editor, and it will not appear in LoT Flow. Deploy it — with Deploy All, or by running the individual cell — and it appears. Cells already live on the broker are marked DEPLOYED.
If an entity you just wrote is missing from LoT Flow, check that it was deployed. Broker runtime in the LoT Editor is the authoritative list of what is actually running on the broker, and the graph matches that list.
Accessing LoT Flow
Select LoT Flow in the HUB dock. The window header carries aBeta badge. The canvas top-right cluster is the layout chrome:
Zoom, pan, Fit View, and Download image sit at the bottom-left of the canvas. Fit the view after Reset layout or after changing grouping — a freshly laid-out graph is often off-centre.
The Entity Rail
The Entities tab groups everything deployed, with a count per group and a Find entity search for jumping straight to one by name:
Selecting an entity focuses it on the canvas and opens its detail panel.
The Python group lists the individual functions invoked from Actions, so its count is usually higher than the number of Python scripts deployed. A single script exposing four functions appears as one entity under Broker runtime in the LoT Editor and as four nodes here.
Reading the Graph
The canvas draws your entities, the topics that wire them together, and the Python they call:
Edges are colour-coded by relationship — solid lines are live data flow, muted dashed lines are structure. The vocabulary covers
publish/sub, trigger, write, event, python call, dependency (a value read but not triggered on), internal state, extends, and grouping links. Turn on the Legend from the Settings tab while you are still learning it.
LoT Rules are not drawn on the canvas. Rules govern access control rather than moving data, so the graph focuses on Actions, Models, Routes, and Python. Rules deployed on your broker still appear under Broker runtime in the LoT Editor.
How a single Action becomes a subgraph
The Action below reads four topics, calls two Python functions, and publishes a Model to a status topic:temp, dependency edges from the three topics it reads, python call edges to both BuildingInsights functions, and an edge to the Model that publishes the result. You can read the same relationships from the other direction in the UNS Viewer, where each topic reports the Actions and Routes that produce and consume it.
Inspecting an Entity
Select any node, or any entity in the rail, to open its detail panel.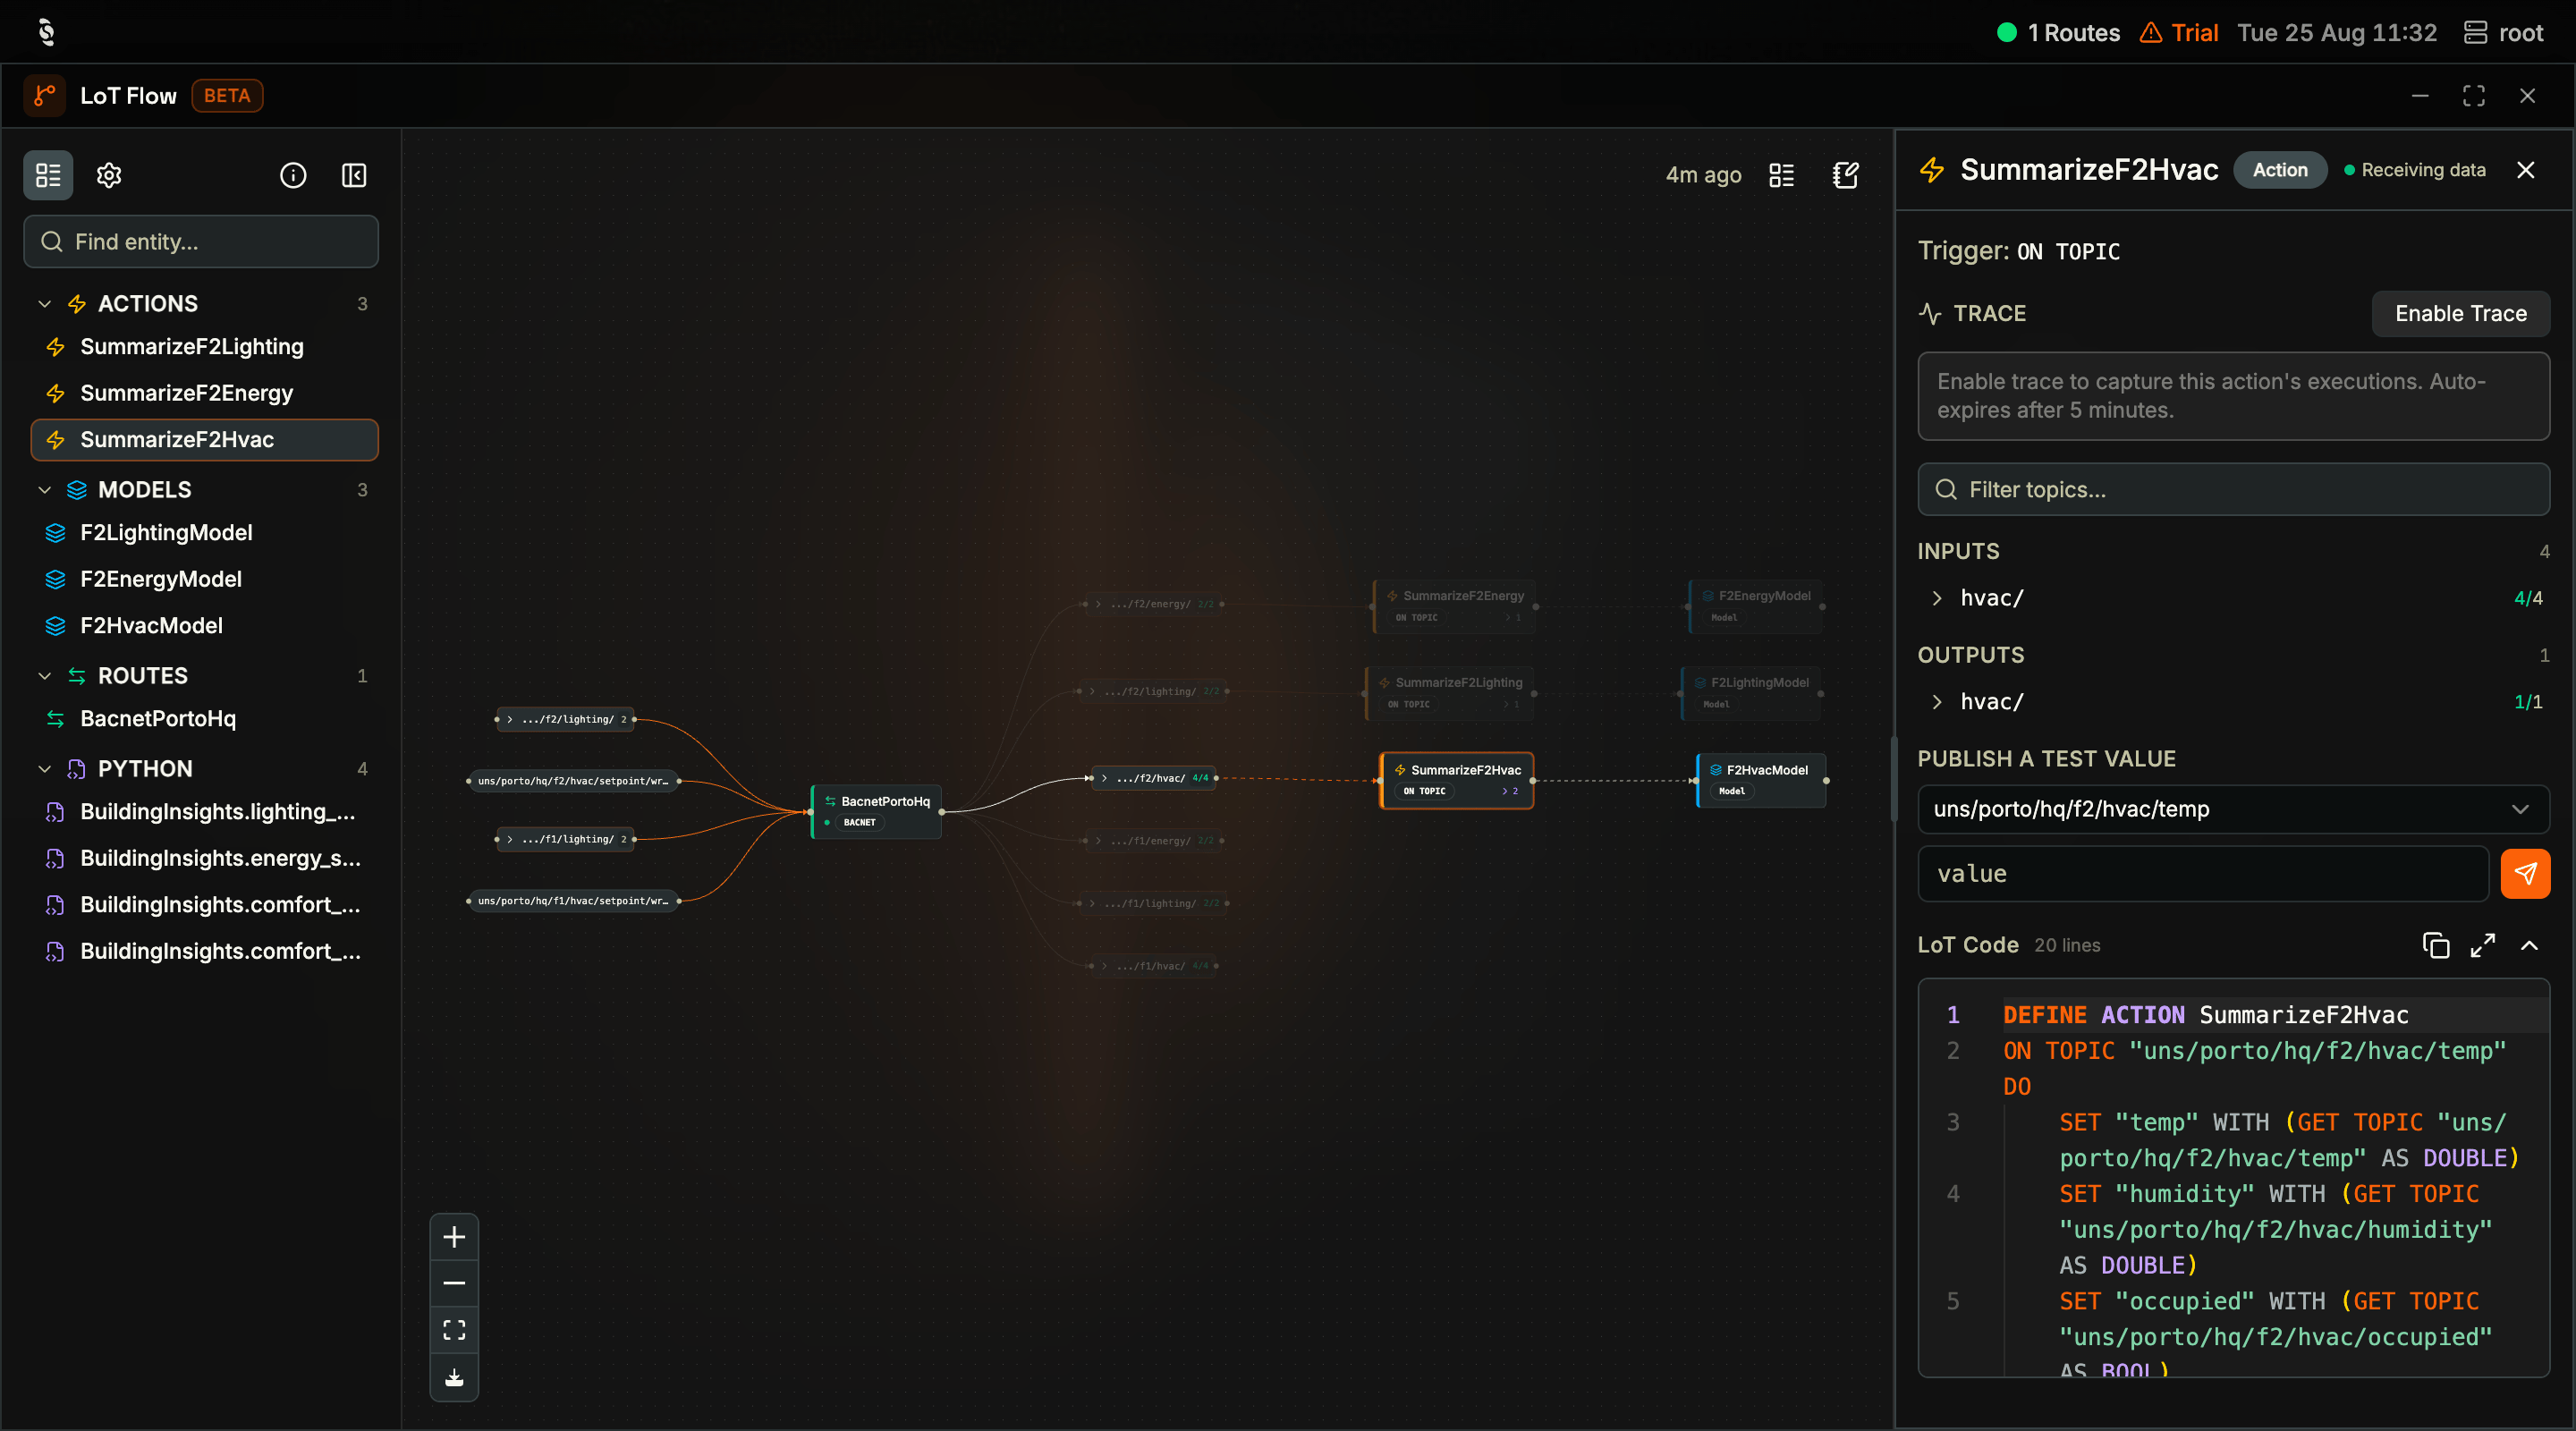
The detail panel for the SummarizeF2Hvac Action: a Receiving data status, its ON TOPIC trigger, Trace, 4 inputs and 1 output, Publish a test value, and the deployed LoT source — with topics still grouped on the canvas so the graph stays readable beside the panel
- Its trigger and a live status such as
Receiving data - Inputs and outputs — the topics it consumes and produces, with counts
- The deployed LoT source, syntax-highlighted, so you can read what is actually running
- Route status for Route entities, including connection health
- Trace — capture this Action’s executions to see it run. Traces auto-expire after five minutes
- Publish a test value — send a value to one of the entity’s topics to exercise it
Keeping Large Graphs Readable
The Settings tab is the Canvas menu — grouping, look, and collapse live here. Layout itself is the Reset layout control at the top-right of the canvas, not in this list.
After you change grouping, click Reset layout (top-right of the canvas) so the remaining nodes are placed again, then Fit View. Collapsing without resetting leaves the old positions and a lot of empty space.
Topic grouping is the most effective control on a busy namespace: Collapse over
1 folds each floor/device prefix — …/f2/hvac/ 4/4, …/f2/energy/ 2/2 — into one node. The relationships stay on the graph; only the leaf clutter goes.
Next Steps
UNS Viewer
Explore the topic namespace those entities read from and write to.
LoT Editor
Create and deploy the entities that appear in this graph, cell by cell.