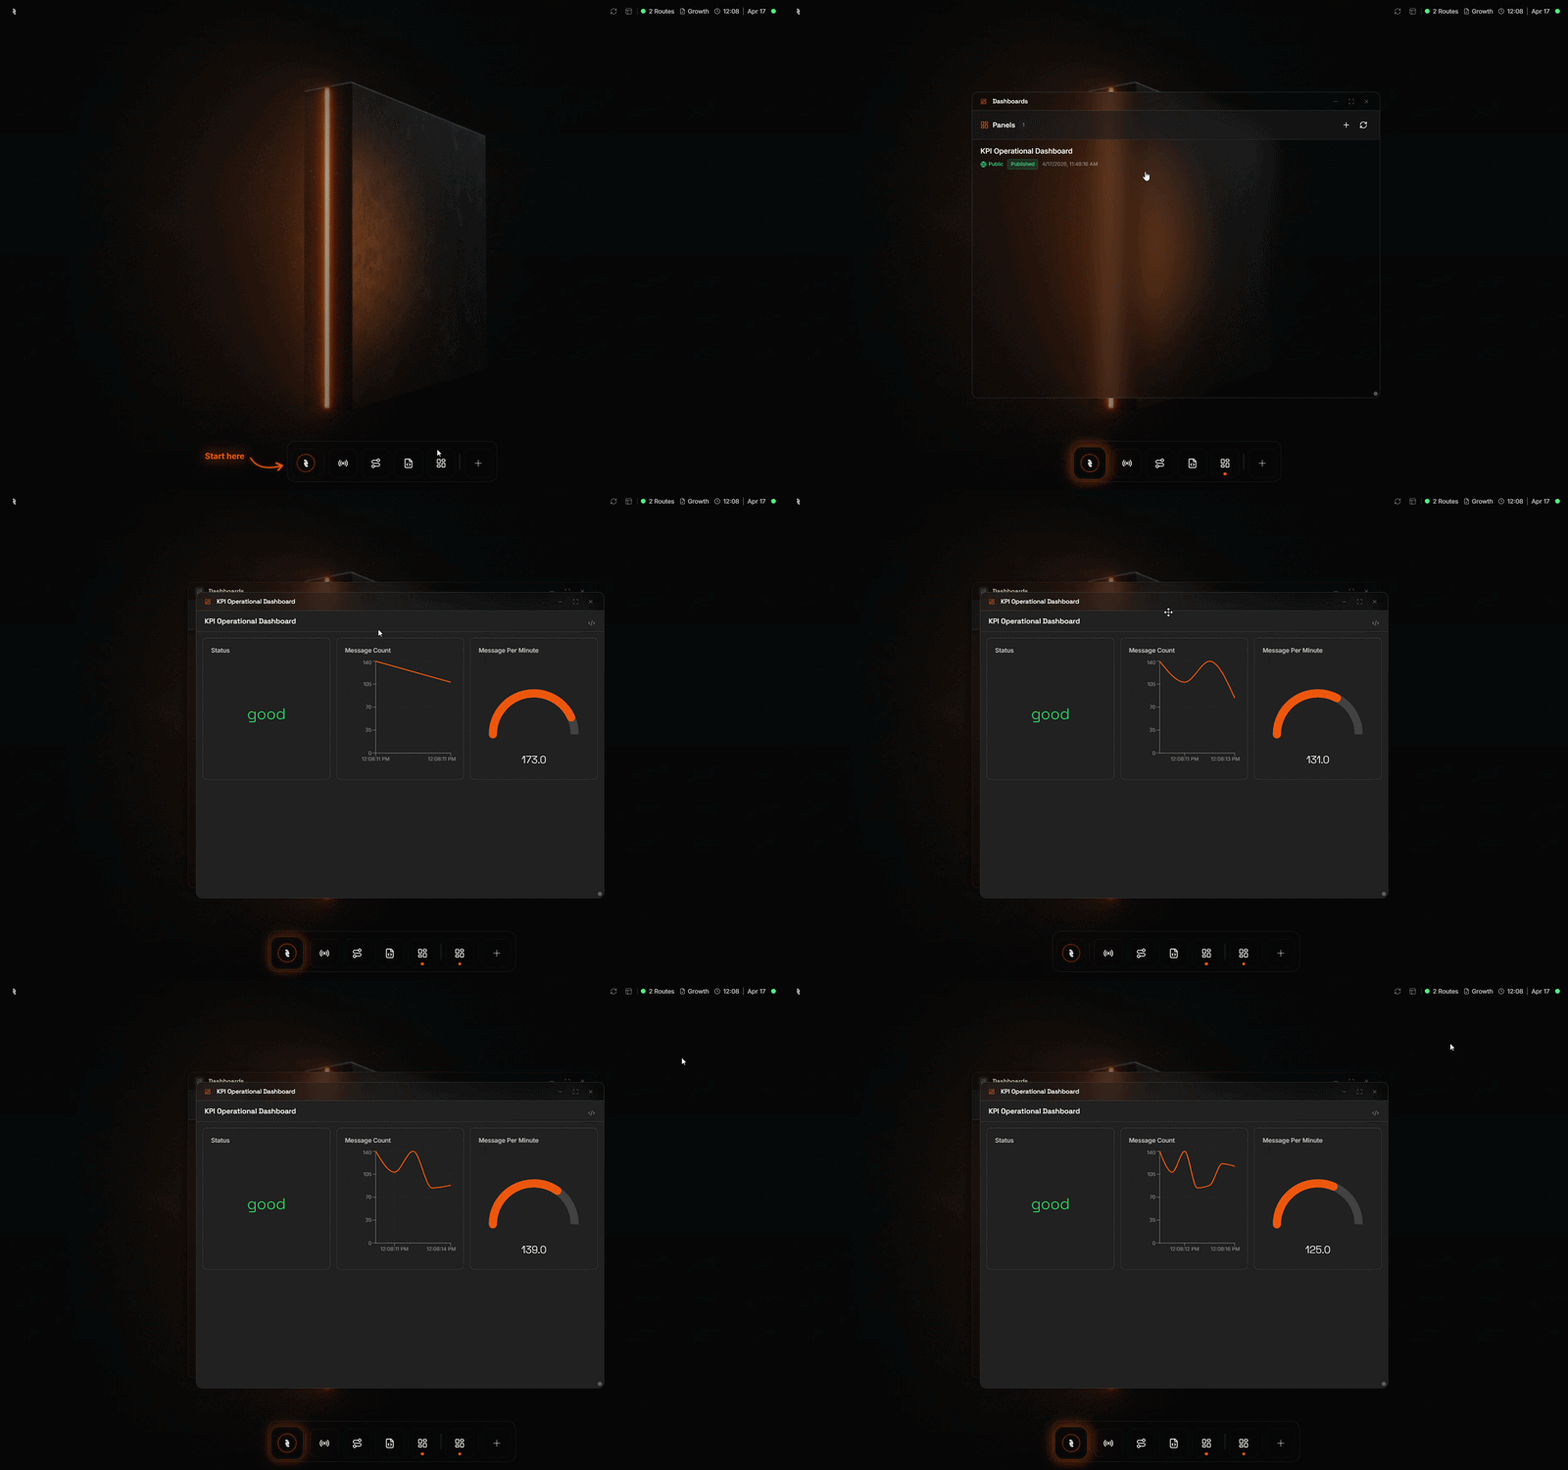
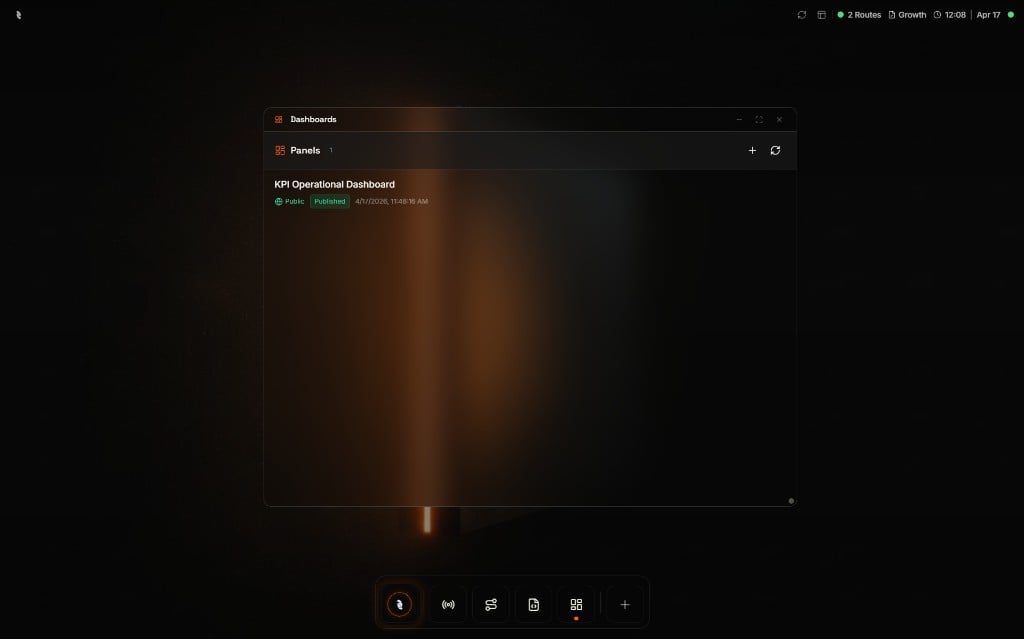
The Dashboard Manager is an app inside the Coreflux HUB. It lists your panels (each panel is one dashboard you can open, share, or refine). From here you add panels, refresh the list, and open a panel to see it live.
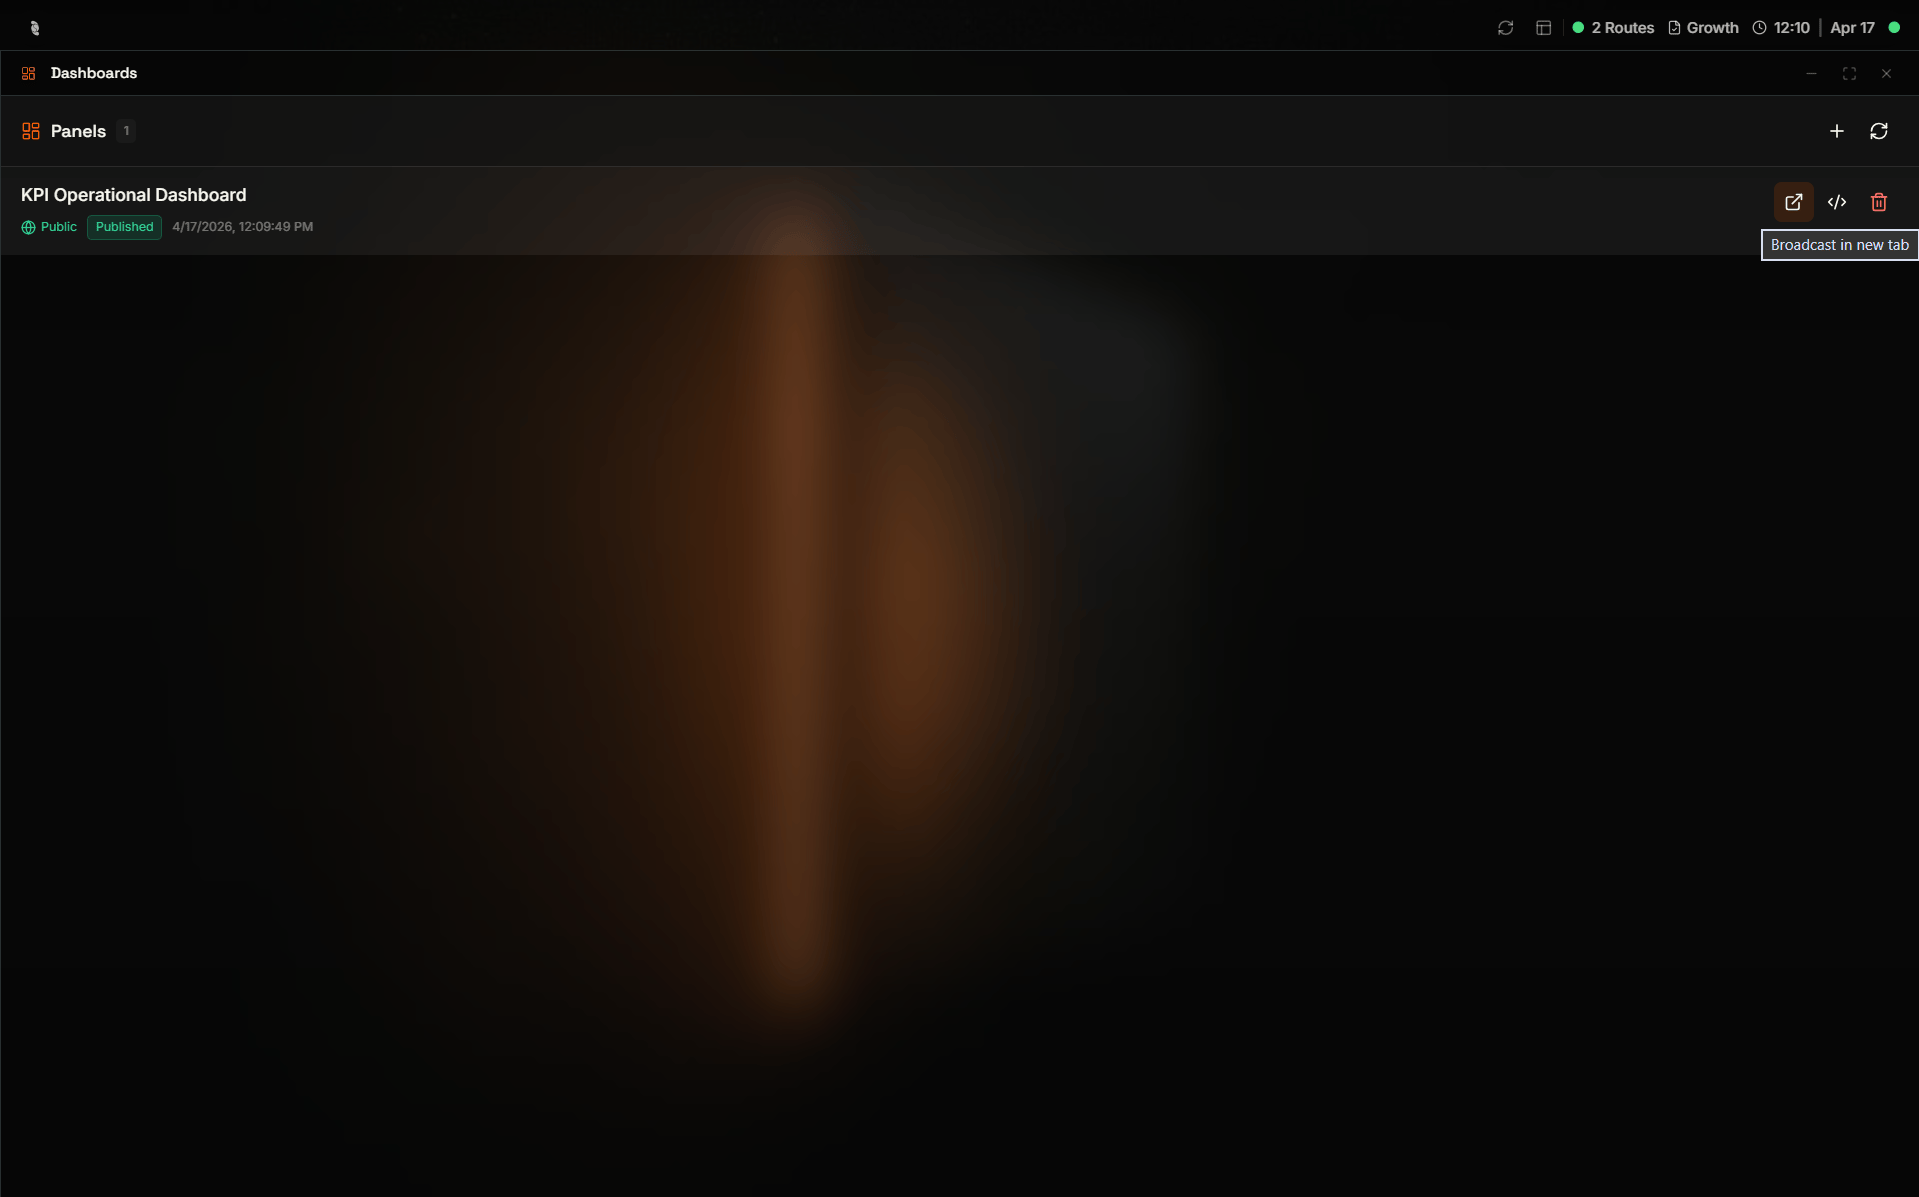
Dashboard Manager — Panels list with one published panel and status badges
The Dashboard Manager and the AI Assistant both produce the same thing: a LoT panel definition (DEFINE PANEL …). The Manager shows that definition next to its live result so you can edit either by hand or by asking the assistant. The LoT PANEL reference documents every panel keyword, component, binding, and event.
Dashboards in the HUB
The widget tour, the 60-second first panel, and what dashboards can do.
Defining a panel
Read and write the DEFINE PANEL source behind every dashboard.
Each component is tied to live data on your broker—typically a topic that already carries the signal from your machines, databases, or Routes. When that topic’s value changes, the widget updates. You do not configure polling or manual refresh for normal operation.
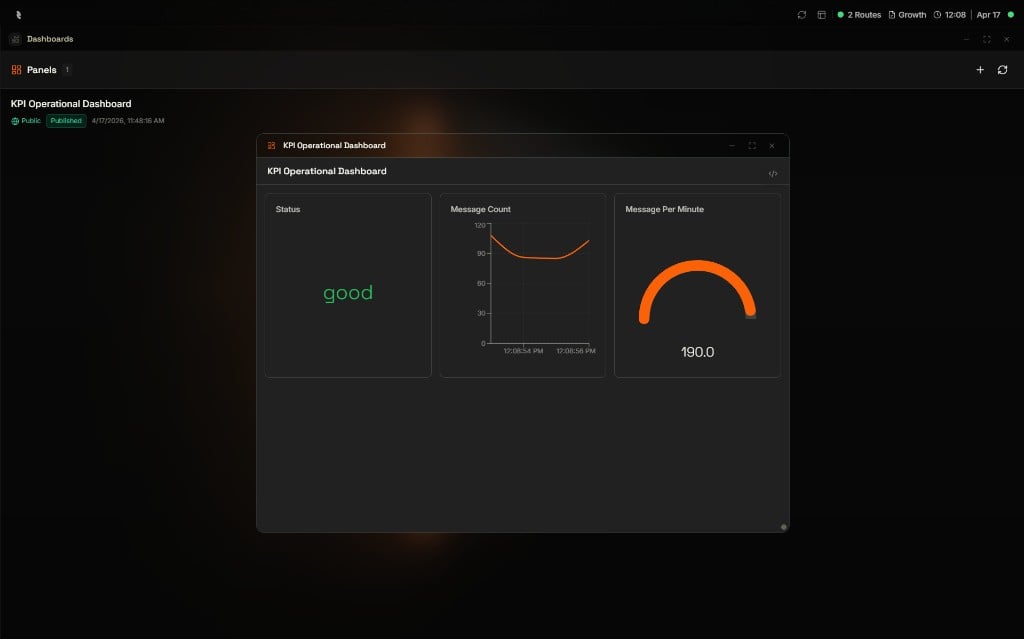
Panel opened as a floating window over the HUB — widgets reflect live topic values
You can experience the same panel in more than one layout depending on where you need it.
As a window
Full screen
Open the panel as a floating window on top of the HUB. That keeps the rest of the HUB—routes, Data Viewer, configuration—one click away while you watch live values or try layout changes.
Panel as a floating window over the HUB — live widgets stay visible while you work elsewhere
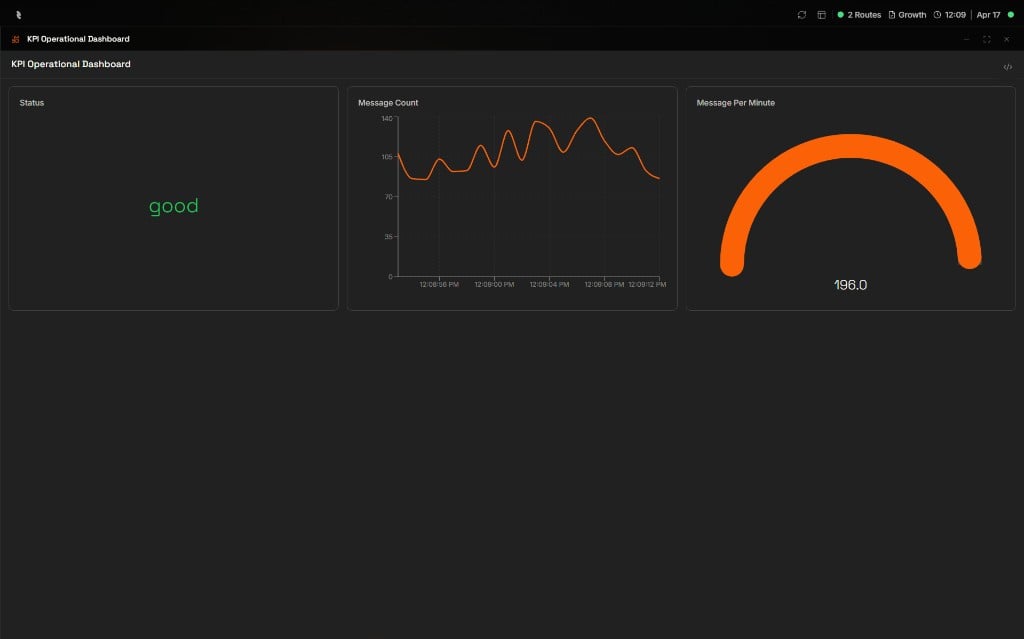
Open the panel in a dedicated full view when you want a clean surface for a plant display, a wall-mounted screen, or a link you share with people who only need the dashboard.
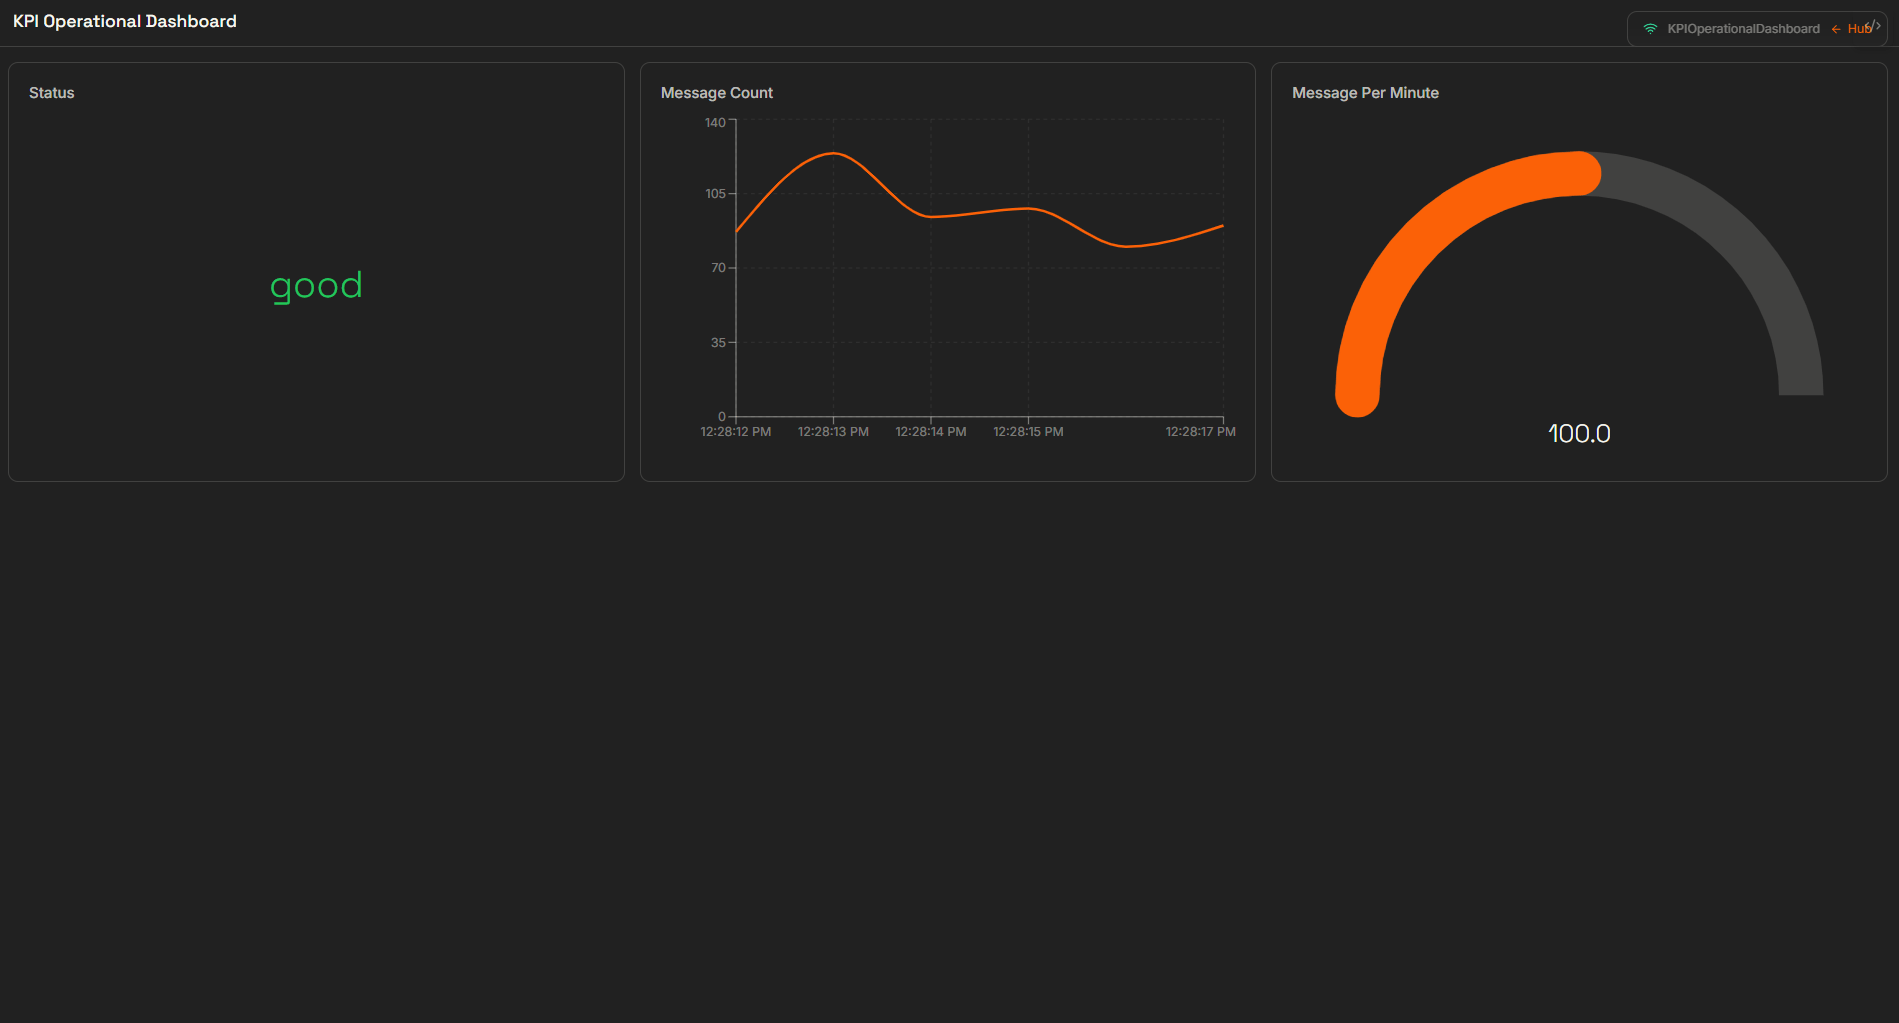
Panel in full view — a clean surface for wall displays and shared links
Each row in the panel list shows the panel name, a visibility hint (for example Public), its publication state (for example Published), and when it was last updated. Clicking the row itself opens the panel; hovering reveals a row of quick actions on the right for sharing, inspecting, and deleting.
Action
How to trigger it
What it does
Open as a window
Click the panel row
Opens the panel as a floating window on top of the HUB so you can keep working while it stays live
Open as a link
Click the first icon on the right (external link)
Opens the panel in a dedicated shareable view—useful for plant displays, wall screens, or sending a URL to a teammate
View source
Click the second icon on the right (code)
Shows the panel’s underlying definition so you can inspect or copy it
Delete dashboard
Click the last icon on the right (trash)
Removes the panel from the list after confirmation
Panel row with quick actions — open as link, view source, and delete
You can put the same live panel on any screen that runs a browser—control-room wall TVs, lobby KPI boards, shop-floor tablets, or a monitor at a remote site—without installing a separate HMI app or giving everyone full access to the Coreflux HUB. The shareable panel URL opens a dedicated view of that dashboard so viewers see only the panel, not routes, configuration, or other HUB apps.From the Dashboard Manager, hover the panel row and click the external link icon (first action on the right). That opens the panel in a dedicated tab or window; copy the URL from the address bar and paste it into a browser on a TV stick, kiosk PC, tablet, or any display you want to keep on the loop.
Same live stream as inside the HUB. The shareable URL reflects broker data the same way as the floating window—widgets update when topics change, without manual refresh for normal operation.
Typical uses:
Control-room and plant walls — Full-screen dashboards that stay readable from a distance
Lobby and office KPI screens — Management views without exposing operator tools
Shop-floor tablets — Lightweight devices that only need one panel
Stakeholders and contractors — A single URL when someone needs read-only visibility
Open the panel as a shareable URL for TVs, kiosks, and external displays
Deleting a panel from the list removes that dashboard permanently after confirmation.