

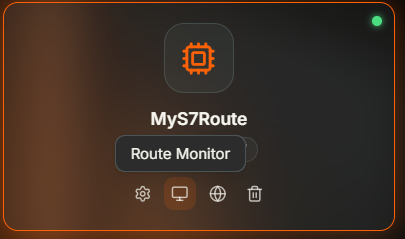
Route card for MyS7Route with the monitor icon highlighted and a Route Monitor tooltip
Why Monitor Routes?
You need to know whether a route is running correctly — whether it is connected, how many messages it has processed, and whether there are errors. The Monitor window gives you live status metrics and real-time logs filtered to a single route, so you can troubleshoot without searching through broker-wide output.When to Use It
- Verifying connectivity — Confirm that a route is connected to its target system after creation or configuration changes
- Tracking activity — Check message counts and error rates to validate that events and mappings are executing
- Troubleshooting connections — See why a route failed to connect using status details and log entries
- Exporting for analysis — Download filtered logs as JSON, CSV, or LOG for offline review
Accessing the Monitor
Open the Routes Manager, click on a route card, and select Monitor. The Monitor window opens with two tabs: Status and Logs.
Opening the Monitor from a route card in the Routes Manager
Status Tab
The Status tab displays live metrics from the broker for the selected route.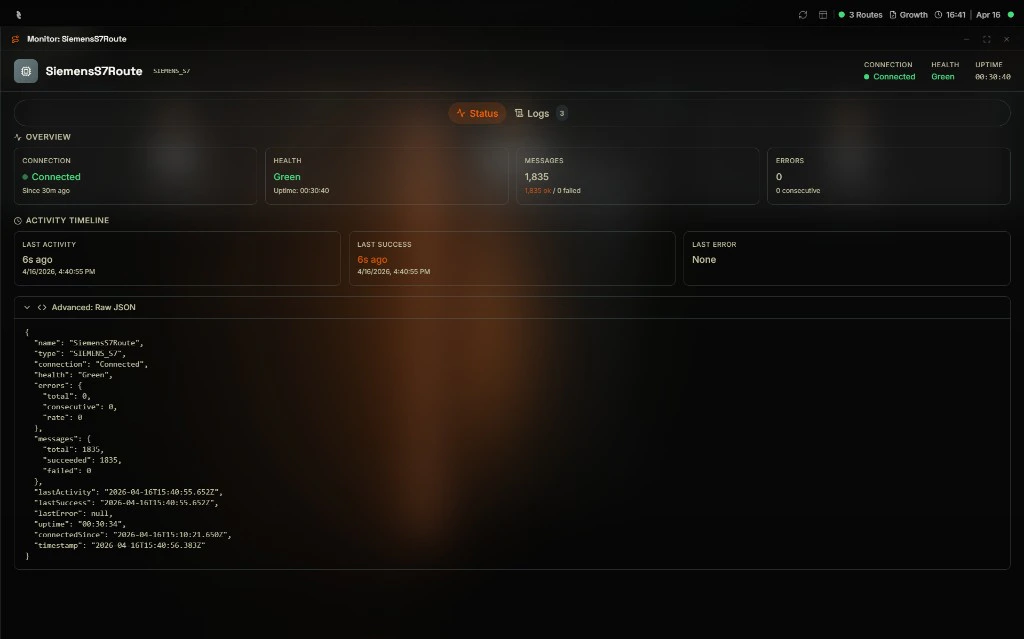
Monitor: SiemensS7Route — Status tab showing connection state, health, message count, error count, activity timeline, and the raw JSON status payload
The Activity Timeline shows timestamps for last activity, last success, and last error. The Advanced: Raw JSON section shows the full status payload from the broker, including uptime and connection timestamps.
Logs Tab
The Logs tab shows real-time log entries filtered to the selected route.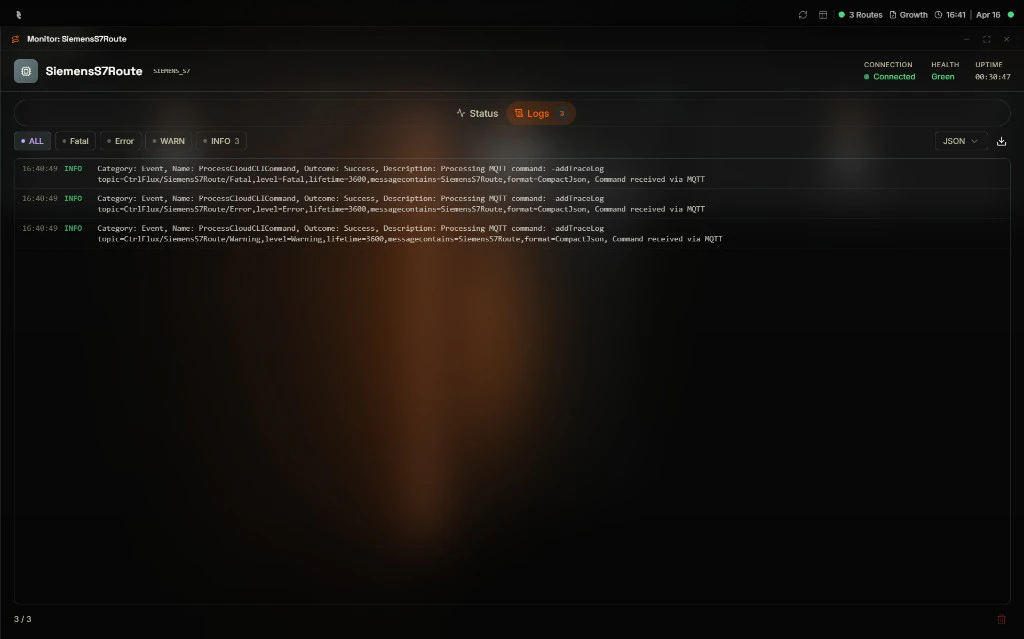
Monitor: SiemensS7Route — Logs tab showing three INFO entries for ProcessCloudCLICommand with level filters, JSON format selector, and export controls
Filter by Level
Use the filter buttons to show only certain log levels:Log Entry Fields
Each log entry displays:Export
Use the export dropdown to choose a format:- JSON — Structured export for parsing or integration
- CSV — Spreadsheet-friendly format
- LOG — Plain text log file
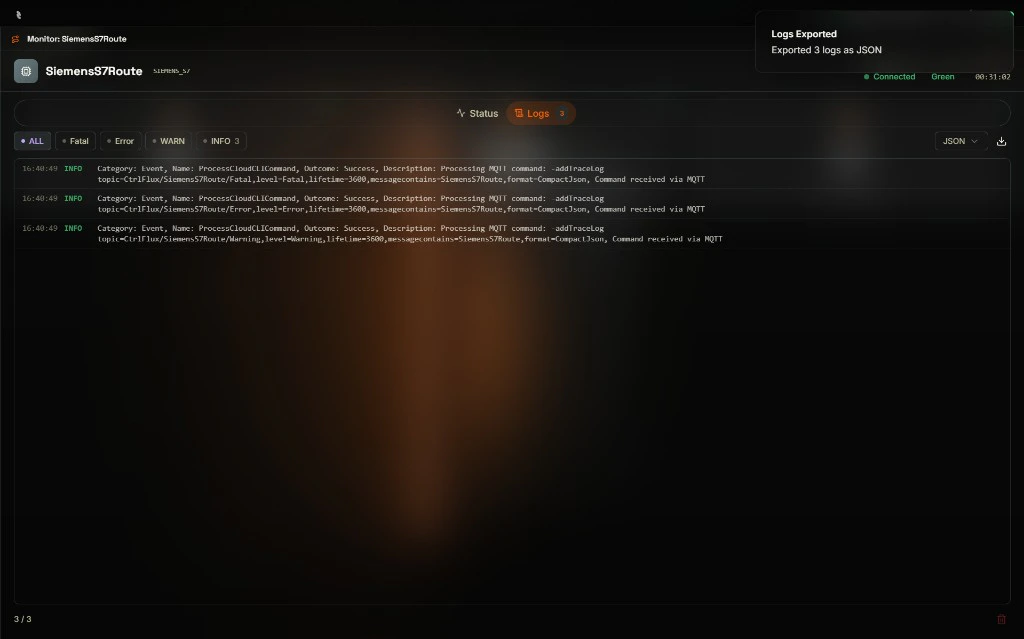
Exporting SiemensS7Route logs as JSON with a Logs Exported confirmation toast in the top-right corner
Clear Logs
Use Clear Logs to remove displayed entries from the view. This does not affect the broker — it only clears the HUB display.Next Steps
Routes Configuration
Edit route settings if status or logs show connection or configuration issues.
Broker Logs
View broker-wide logs for system-level troubleshooting.