

Documentation Index
Fetch the complete documentation index at: https://docs.coreflux.org/llms.txt
Use this file to discover all available pages before exploring further.
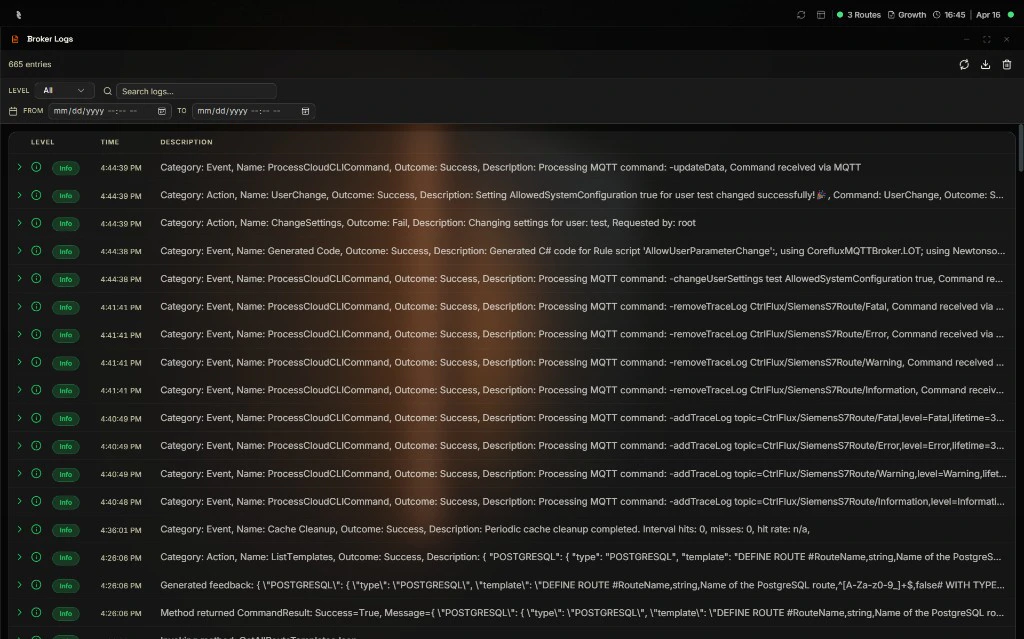
Why Use Broker Logs?
You need to see what the broker is doing—startup messages, connection events, errors, warnings. The Broker Logs in the Coreflux HUB show broker-wide logs with filtering, search, and export so you can troubleshoot and audit broker activity.When to Use It
- Troubleshooting — Find errors or warnings related to broker startup or connections
- Auditing — Review broker activity over a date range
- Exporting — Save logs as JSON or LOG for offline analysis or support
Filter by Level
Use the All Levels dropdown to filter logs by severity:| Level | Description |
|---|---|
| All Levels | Show all log entries |
| Information | Informational messages |
| Warning | Warnings |
| Error | Errors |
| Critical | Critical failures |
Search for Keyword
Use the Search logs… field to search for specific text in log messages. Enter a keyword or phrase to filter the displayed logs.Export
Export logs in two formats:- JSON — Structured export for parsing or integration
- LOG — Plain text log file
Control Refresh Rate
Use the refresh control to set how often logs update:| Option | Description |
|---|---|
| Sync | Real-time updates (continuous) |
| 1s | Refresh every 1 second |
| 5s | Refresh every 5 seconds |
| 10s | Refresh every 10 seconds |
Filter by Date
Use the From and To date fields to limit logs to a specific time range. Enter dates (and optionally times) to filter the displayed entries.Status Indicators
The Broker Logs view shows status such as:- Connected — HUB is connected to the broker
- Logging Initialized — Logging is active
Clear Logs
Use Clear to remove displayed logs from the view. This does not affect the broker—it only clears the HUB display.Next Steps
MQTT Broker
Learn about the Coreflux MQTT Broker.
Introduction to LoT
Learn the fundamentals of the Language of Things and how it works.