

Documentation Index
Fetch the complete documentation index at: https://docs.coreflux.org/llms.txt
Use this file to discover all available pages before exploring further.
Why Monitor Routes?
You need to know whether a route is running correctly — whether it is connected, how many messages it has processed, and whether there are errors. The Monitor window gives you live status metrics and real-time logs filtered to a single route, so you can troubleshoot without searching through broker-wide output.When to Use It
- Verifying connectivity — Confirm that a route is connected to its target system after creation or configuration changes
- Tracking activity — Check message counts and error rates to validate that events and mappings are executing
- Troubleshooting connections — See why a route failed to connect using status details and log entries
- Exporting for analysis — Download filtered logs as JSON, CSV, or LOG for offline review
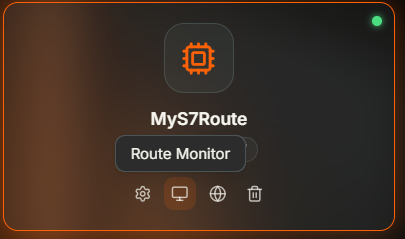
Accessing the Monitor
Open the Routes Manager, click on a route card, and select Monitor. The Monitor window opens with two tabs: Status and Logs.
Status Tab
The Status tab displays live metrics from the broker for the selected route.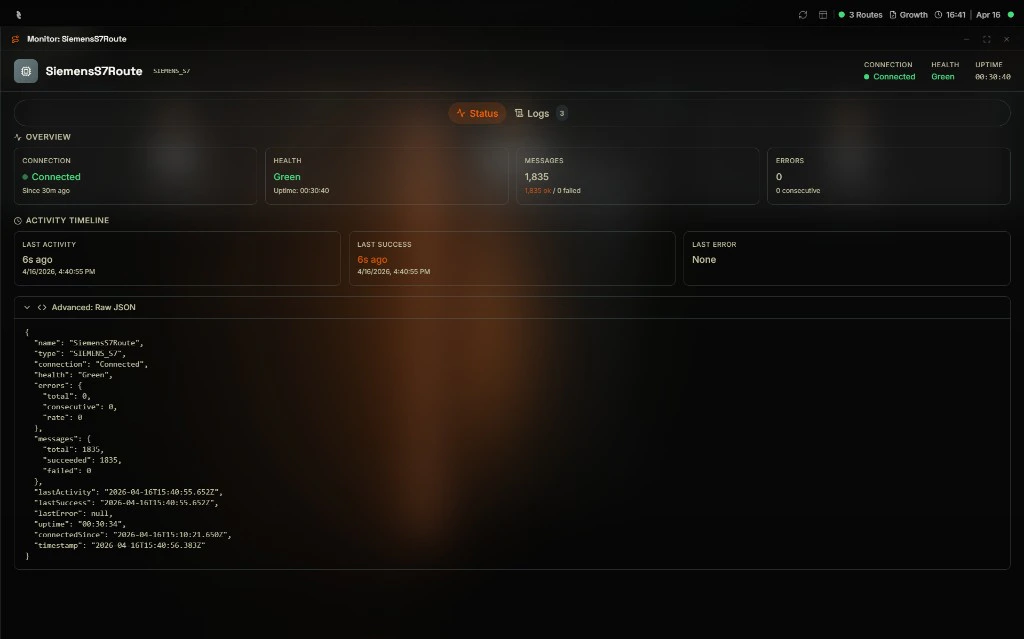
| Field | Description |
|---|---|
| Connection | Whether the route is currently connected to its target |
| Health | Health indicator (Green, Yellow, Red) based on error rates |
| Messages | Total messages processed, with success and failure counts |
| Errors | Total and consecutive error counts |
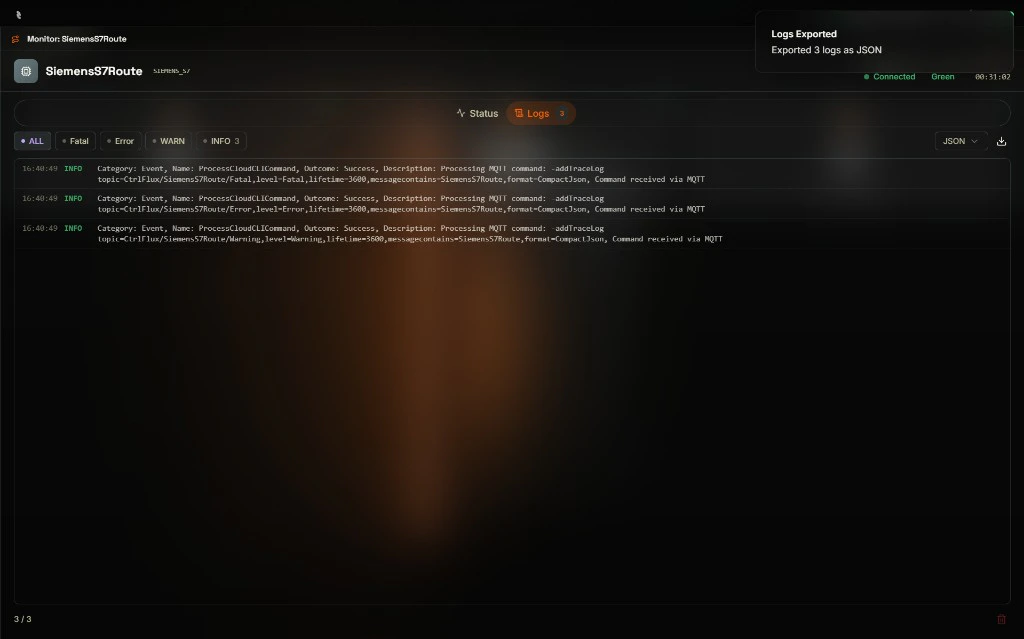
Logs Tab
The Logs tab shows real-time log entries filtered to the selected route.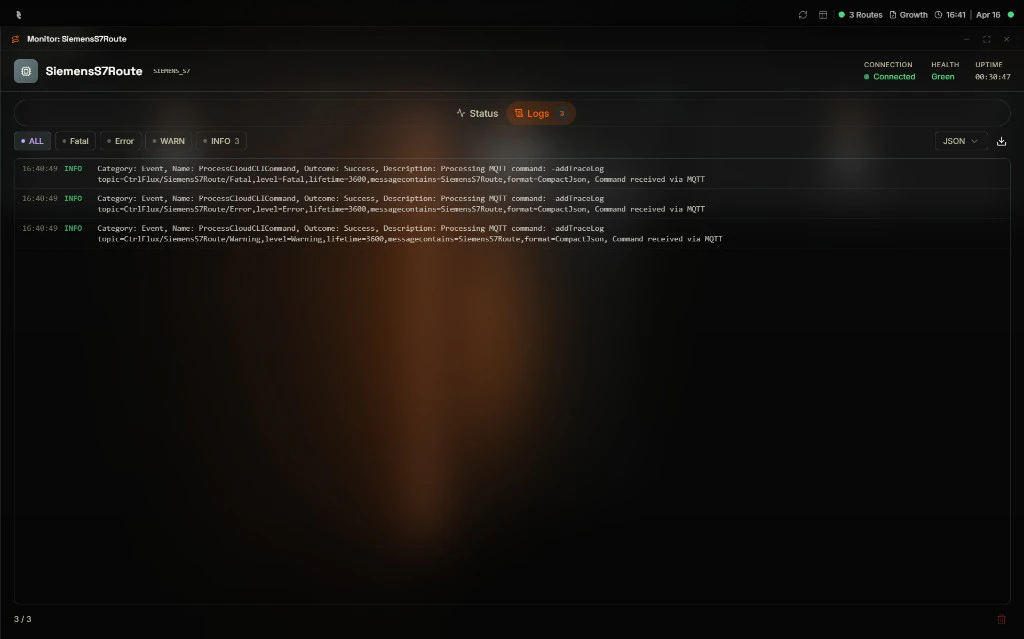
Filter by Level
Use the filter buttons to show only certain log levels:| Filter | Description |
|---|---|
| ALL | Show all log entries |
| FATAL | Fatal errors only |
| ERROR | Errors only |
| WARN | Warnings only |
| INFO | Informational messages only |
Log Entry Fields
Each log entry displays:| Field | Description |
|---|---|
| Timestamp | When the event occurred |
| Log level | FATAL, ERROR, WARN, or INFO |
| Category | Event category (e.g., Action, Event) |
| Name | Event or action name |
| Outcome | Success or failure |
| Description | Detailed message or structured data |
Export
Use the export dropdown to choose a format:- JSON — Structured export for parsing or integration
- CSV — Spreadsheet-friendly format
- LOG — Plain text log file
Clear Logs
Use Clear Logs to remove displayed entries from the view. This does not affect the broker — it only clears the HUB display.Next Steps
Routes Configuration
Edit route settings if status or logs show connection or configuration issues.
Broker Logs
View broker-wide logs for system-level troubleshooting.