

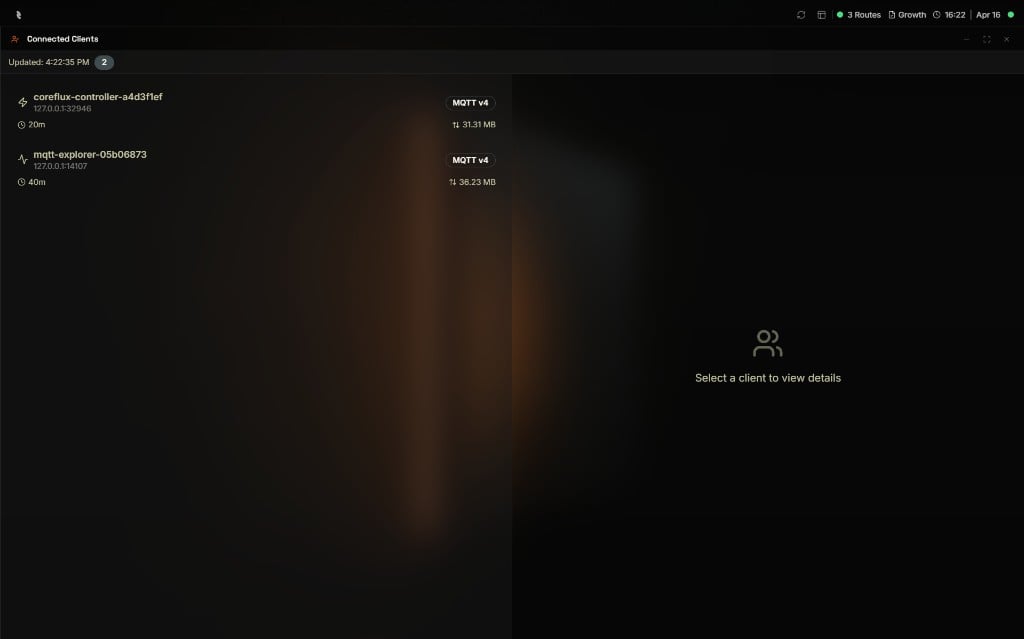
Connected Clients view in the Coreflux HUB showing two active MQTT v4 connections with an empty detail panel
Why View Connected Clients?
You need to know which clients are connected to your broker—devices, applications, or the Coreflux HUB itself. The Connected Clients view shows all active MQTT connections with detailed connection info, traffic statistics, session data, and last activity so you can verify connectivity and troubleshoot disconnections.When to Use It
- Verifying device connections — Confirm that sensors or gateways are connected
- Troubleshooting — Check if a client has disconnected or failed to connect
- Monitoring — See how many clients are using the broker and their traffic
- Debugging — Inspect session state, pending messages, and last activity timestamps
Connected Clients Interface
The Connected Clients view has two panels: a client list on the left and a detail panel on the right. Select a client to view its connection information.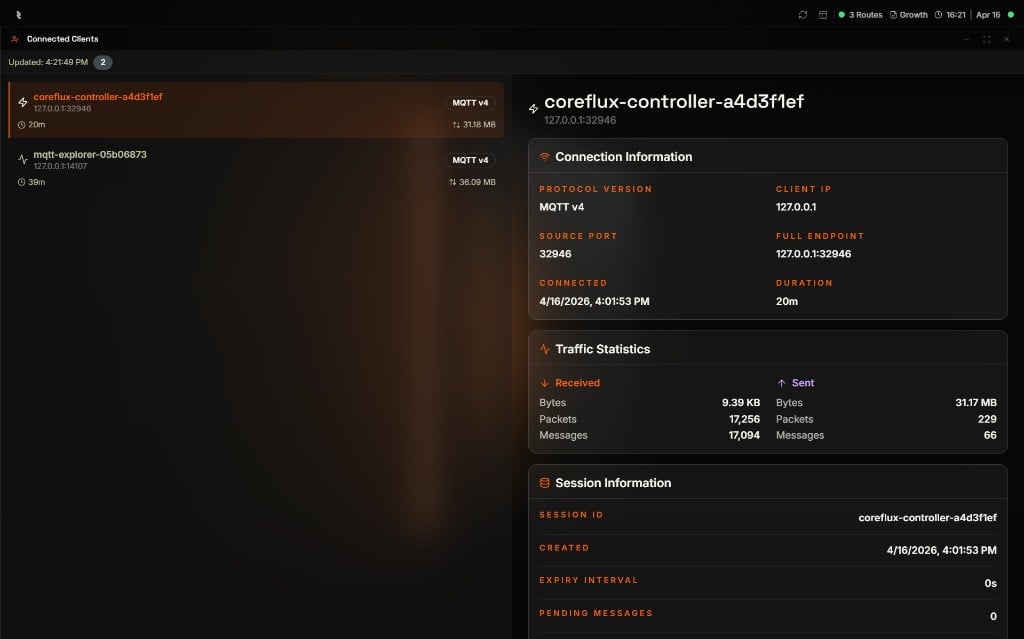
Connected Clients detail panel for coreflux-controller-a4d3f1ef showing connection information, traffic statistics, and session data
Client List (Left Panel)
The left panel lists all clients currently connected to the broker. For each client you see:
Select a client to view its detailed information in the right panel.
Client Details (Right Panel)
When you select a client from the list, the right panel shows four sections:Connection Information
Traffic Statistics
Use these to see how much data the client has exchanged with the broker.
Session Information
Last Activity
Refreshing the List
The view updates as clients connect and disconnect. Use the refresh control if you need to force an update of the displayed list. The detail panel shows an “Updated” timestamp indicating when the data was last refreshed.Next Steps
Data Viewer
Explore topics and publish messages.
MQTT Protocol
Understand MQTT client connections and sessions.