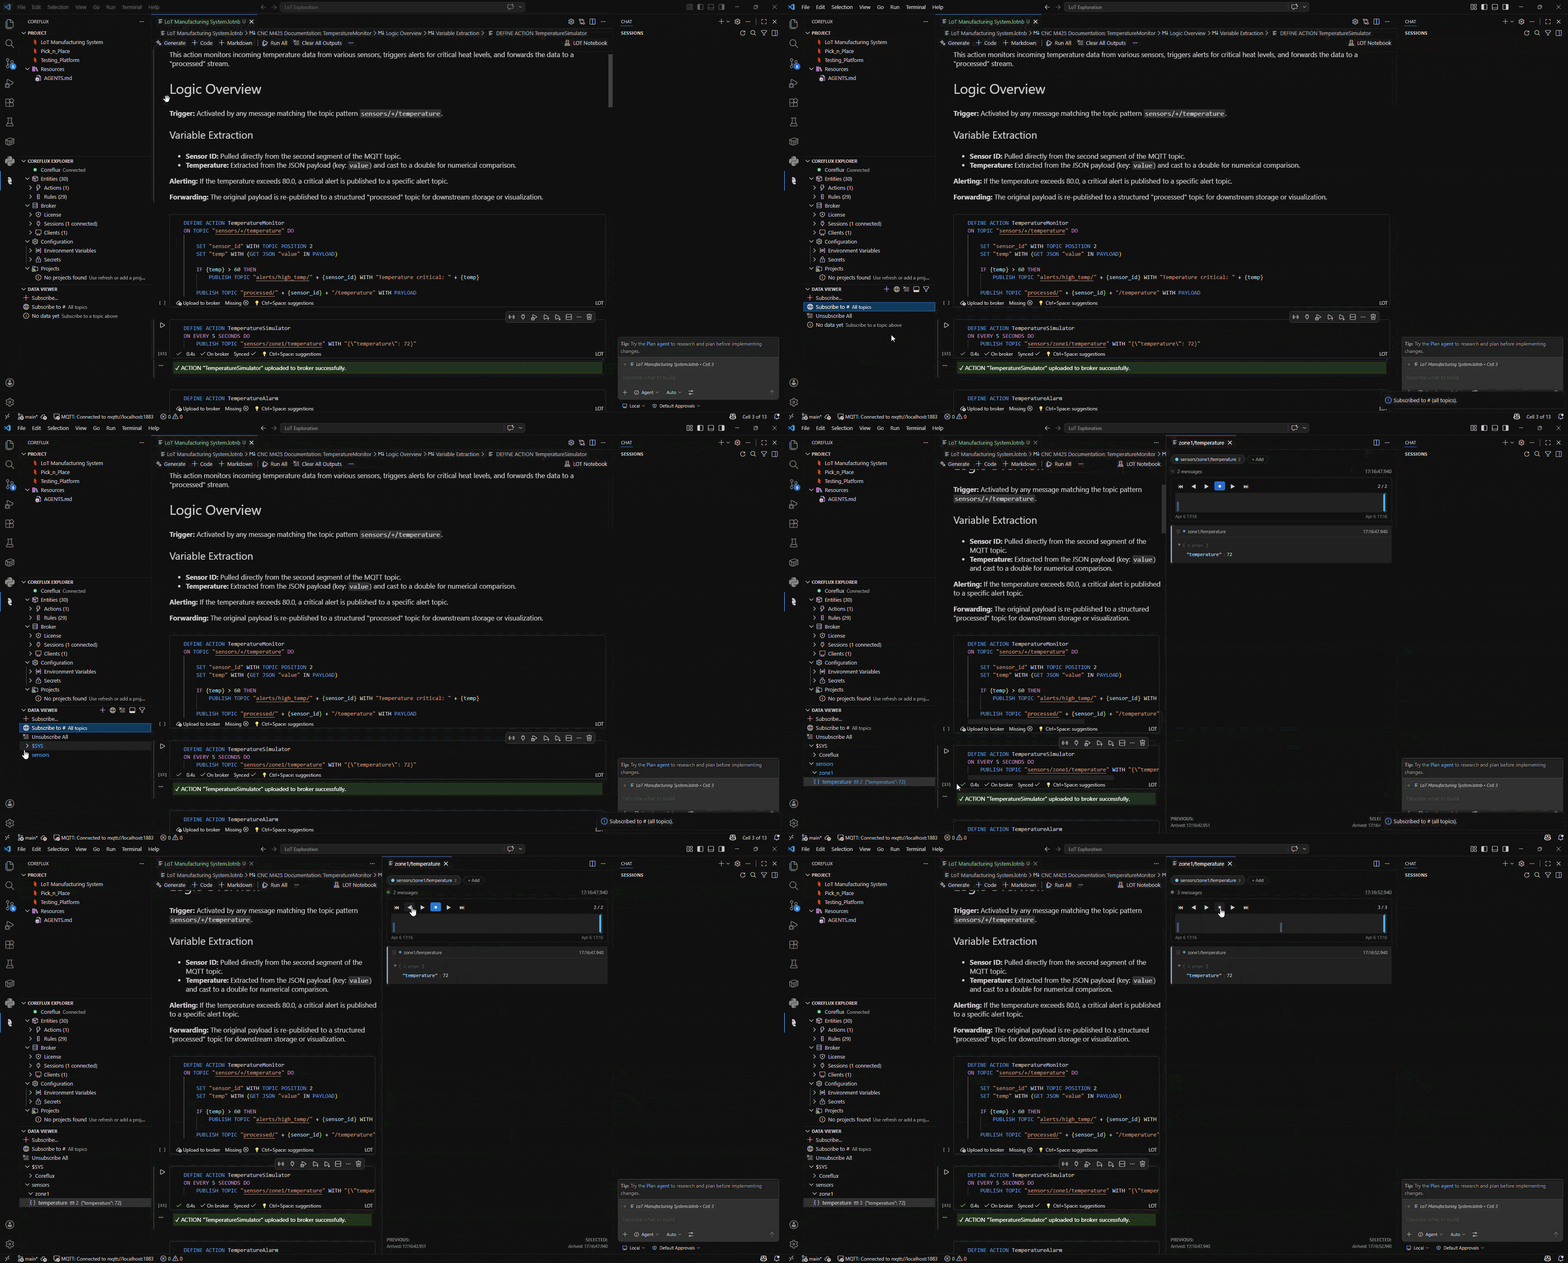
Animated walkthrough of the LoT Data Viewer in VS Code: subscribing to topics and viewing live MQTT traffic

Data Viewer: subscribe to topics and watch live MQTT data

Overview

Debugging in LoT Notebooks means confirming data is moving on the right topics and your logic behaves as intended. The extension includes a Data Viewer and an Execution Trace tied to each LoT cell so you can see data, replay flows and inspect every related topic and variable.
Without the right view, you are mostly in the dark — you write code hoping nothing goes wrong. The Data Viewer and the execution trace light up the room, showing what that code actually did.

Data Viewer

Animated walkthrough of the LoT extension Data Viewer: topic tree, message history, replay, and payload formatters

Data Viewer: topic tree and replay viewer with live data and history replay

Inside Coreflux Explorer, the Data Viewer has two parts that work together:

Topic Tree Viewer

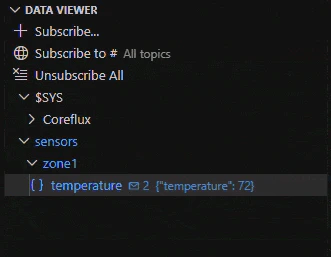
LoT MQTT Topic Tree Viewer, showing topic hierarchy and MQTT Payloads

LoT MQTT Topic Tree Viewer, showing topic hierarchy and MQTT Payloads

The topic tree gives you a quick glance at your hierarchy and live values as messages arrive—handy for spotting whether a sensor topic or alert is updating, without needing to open a separate tool. Use Subscribe to All topics when you want the tree to show all broker data, and Subscribe to a topic when you want to focus on specific information.

Replay Data Viewer

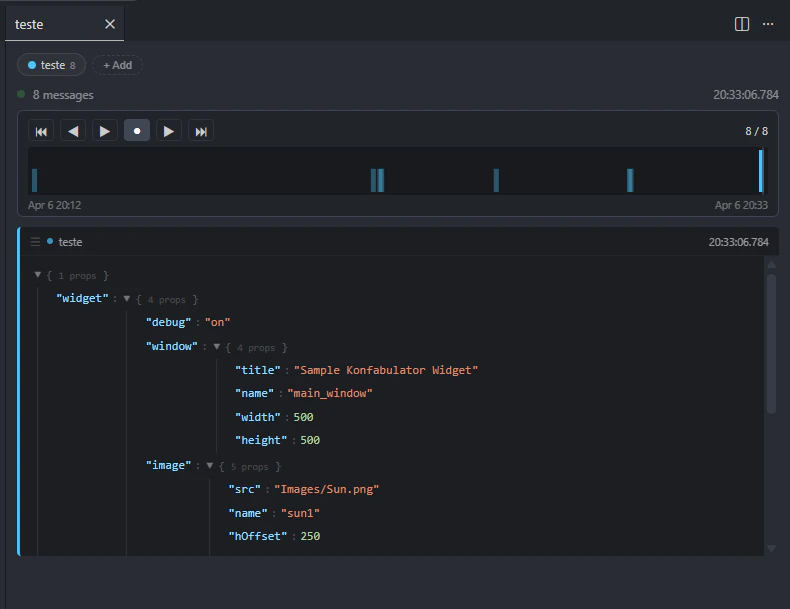
LoT Data Viewer showing JSON formatter with syntax highlighting, topic tab, message count, and timeline replay controls

Data Viewer: data payload, topic tabs, timeline, and replay controls

Click a topic in the tree to open the full Data Viewer for that stream. There you get:
  • Message history and a multi-topic layout so you can follow several related topics at once
  • Replay controls to move through captured messages over time
  • A data formatter so you can interpret payloads the way they were meant to be read—pick the view that matches how the payload is encoded
Use this when you need to inspect structure, compare payloads, or see the data history — not just see that “something changed” on a topic.

Adjust how you see the data

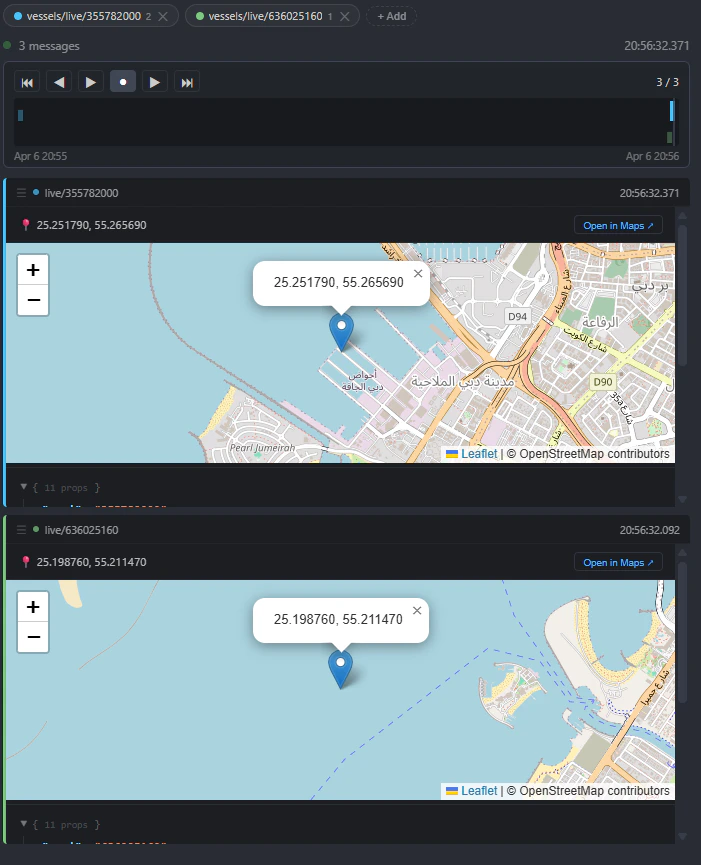
Choose a formatter after opening a topic. The full viewer supports multiple topics, a message history, replay (timeline and playback controls), and data views such as raw, JSON, Protobuf, geopoint, image, audio and PDF.
LoT Data Viewer Geopoint formatter showing geographic coordinates plotted on a map

Data Viewer Geopoint formatter: coordinates on a map


Execution trace

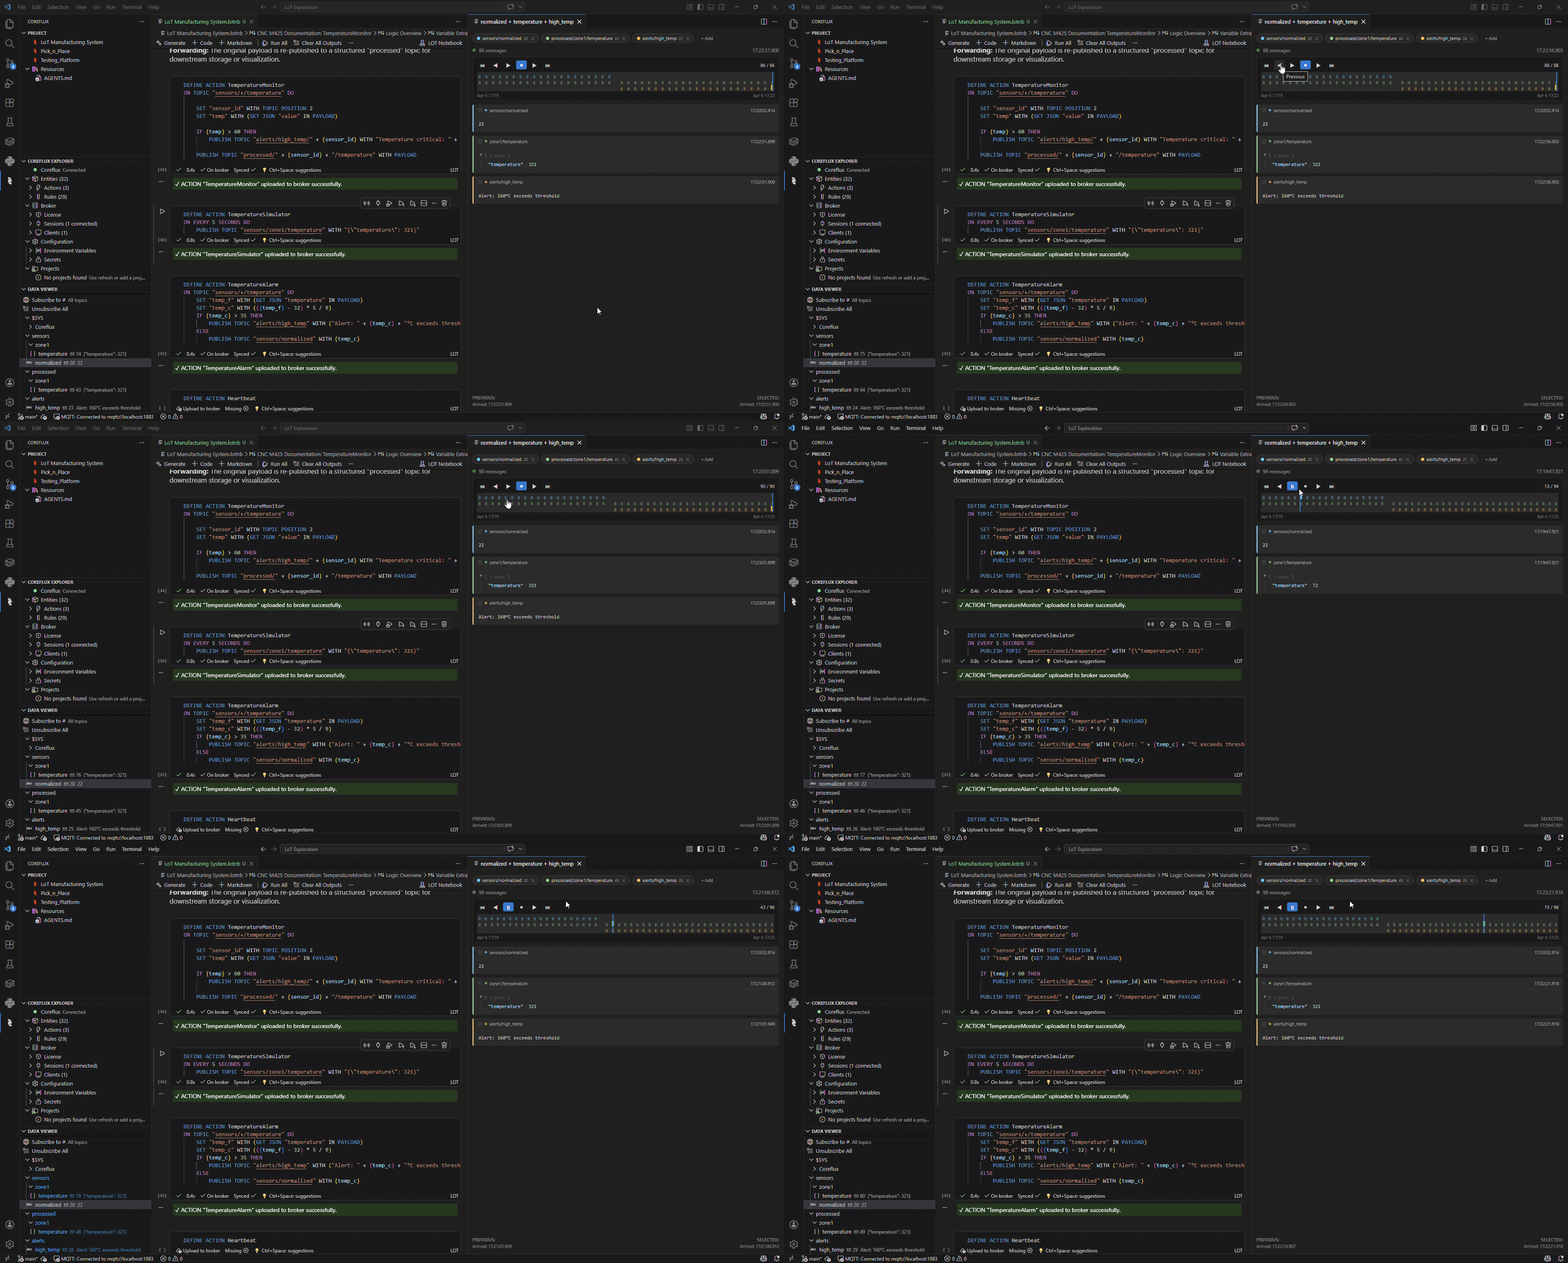
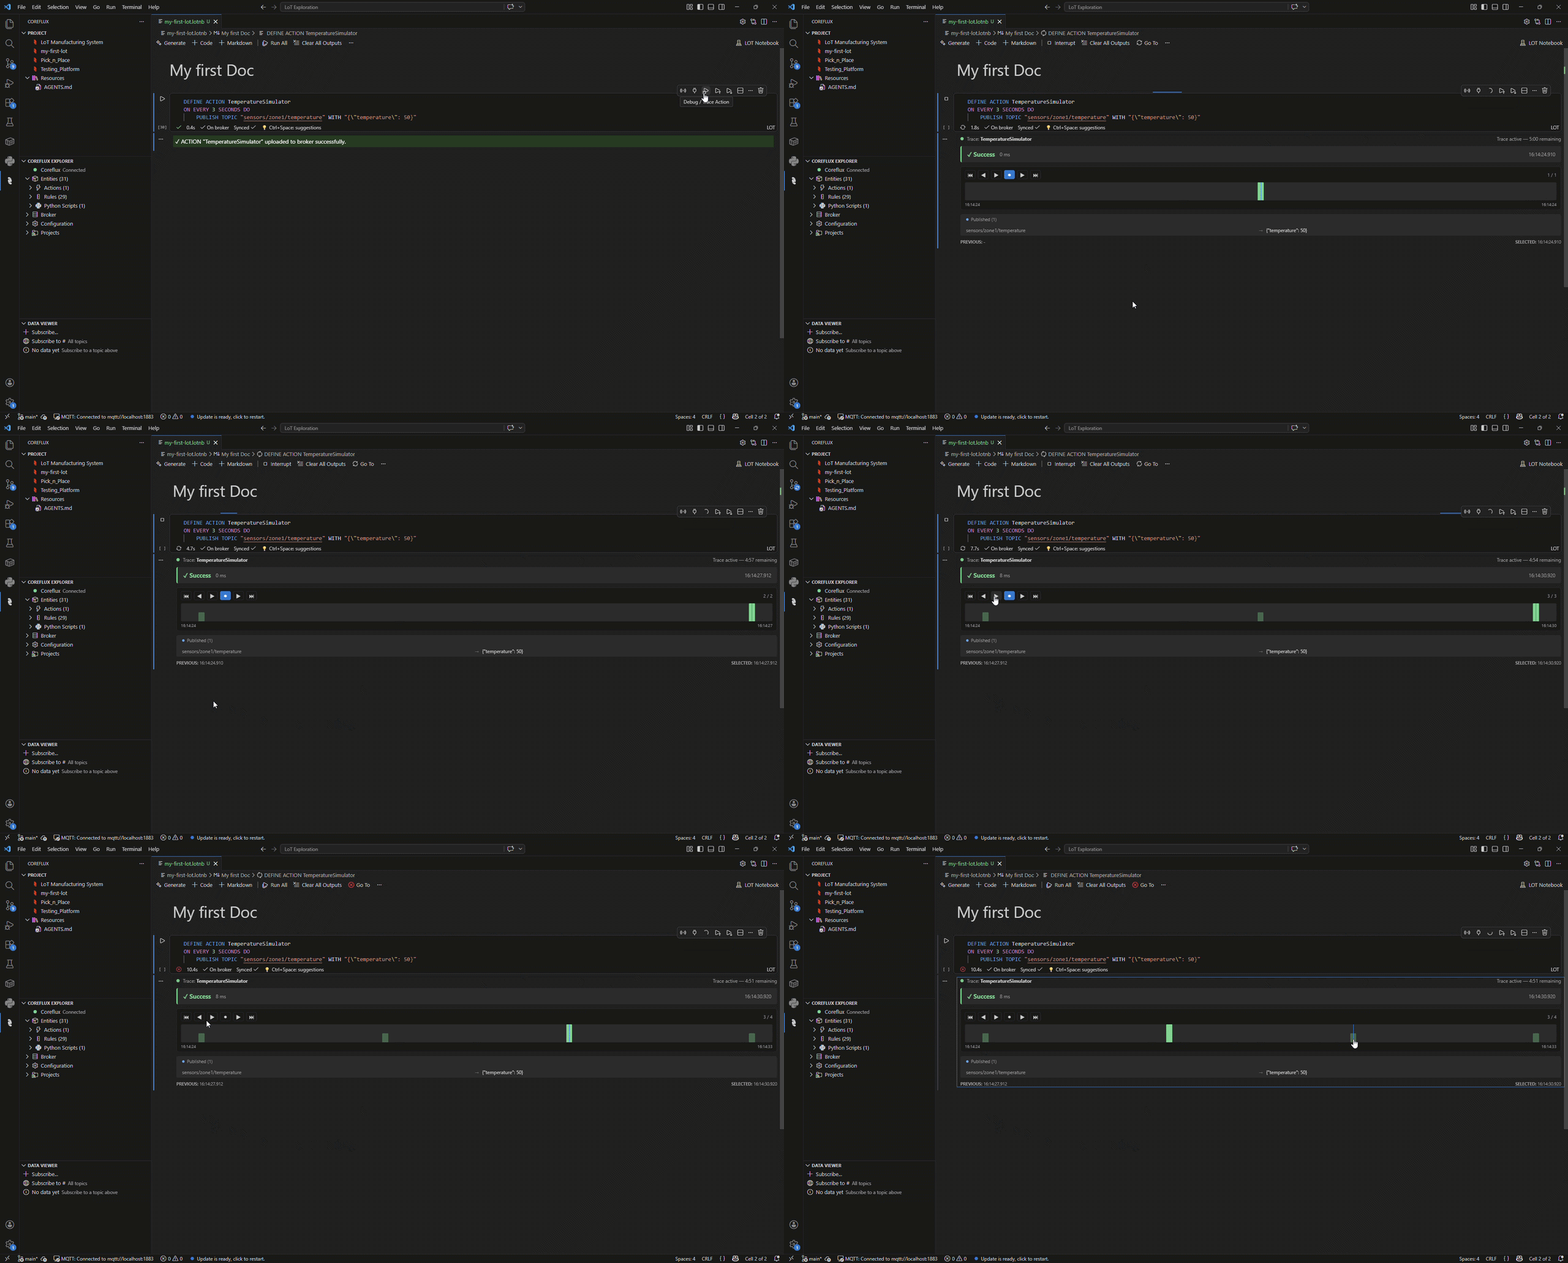
Animated walkthrough of the LoT extension execution trace showing cell-related topics and variables, timeline, and replay

Execution trace: topics and variables for the LoT cell, with timeline and replay

The execution trace lets you see every topic and variable the cell touches—publishes, subscriptions, and related state—in one place, follow a time-ordered history of messages across them, and use replay with playback controls and a timeline to play, pause, and scrub the run. That way you can confirm execution order, timing, and which step produced which message when logic spans several topics. It is scoped to the LoT cell you are debugging, so you stay with that cell’s footprint on the broker instead of hunting traffic across the whole system.


Troubleshooting

When the viewer or trace does not match what you expect, open the sections below.
If cells fail immediately or never show a response, verify credentials and network first.
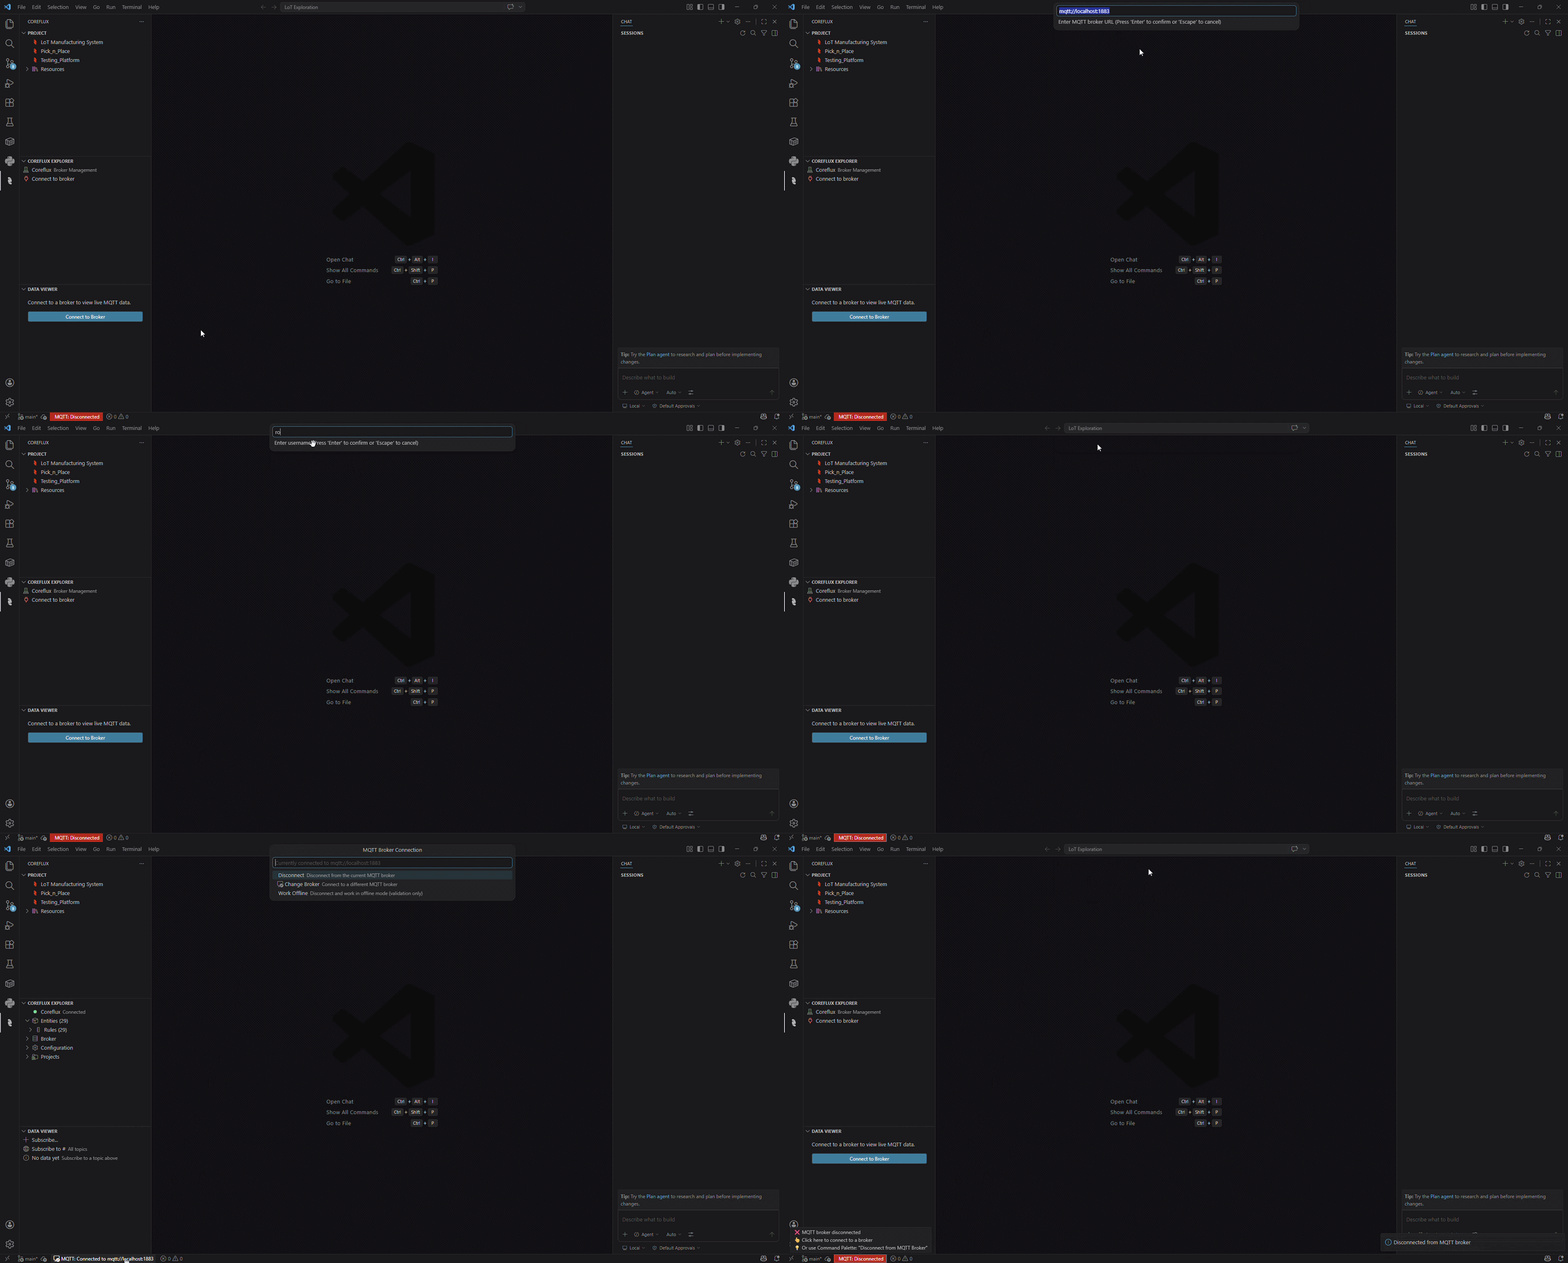
  1. Open the Command Palette (Ctrl+Shift+P or Cmd+Shift+P) or use the connection control in the activity bar / status area as shown in your setup.
  2. Run LoT Notebook: Change Credentials and enter your broker URL, username, and password.
  3. Watch the status bar for a connected state before running cells.
Animated walkthrough of entering broker credentials and connecting in VS Code

Updating broker credentials in the LoT Notebooks extension

  • Default credentials and TLS notes: LoT Notebooks setup guide
  • Confirm the broker is reachable (host, port, firewall, TLS if using mqtts://)
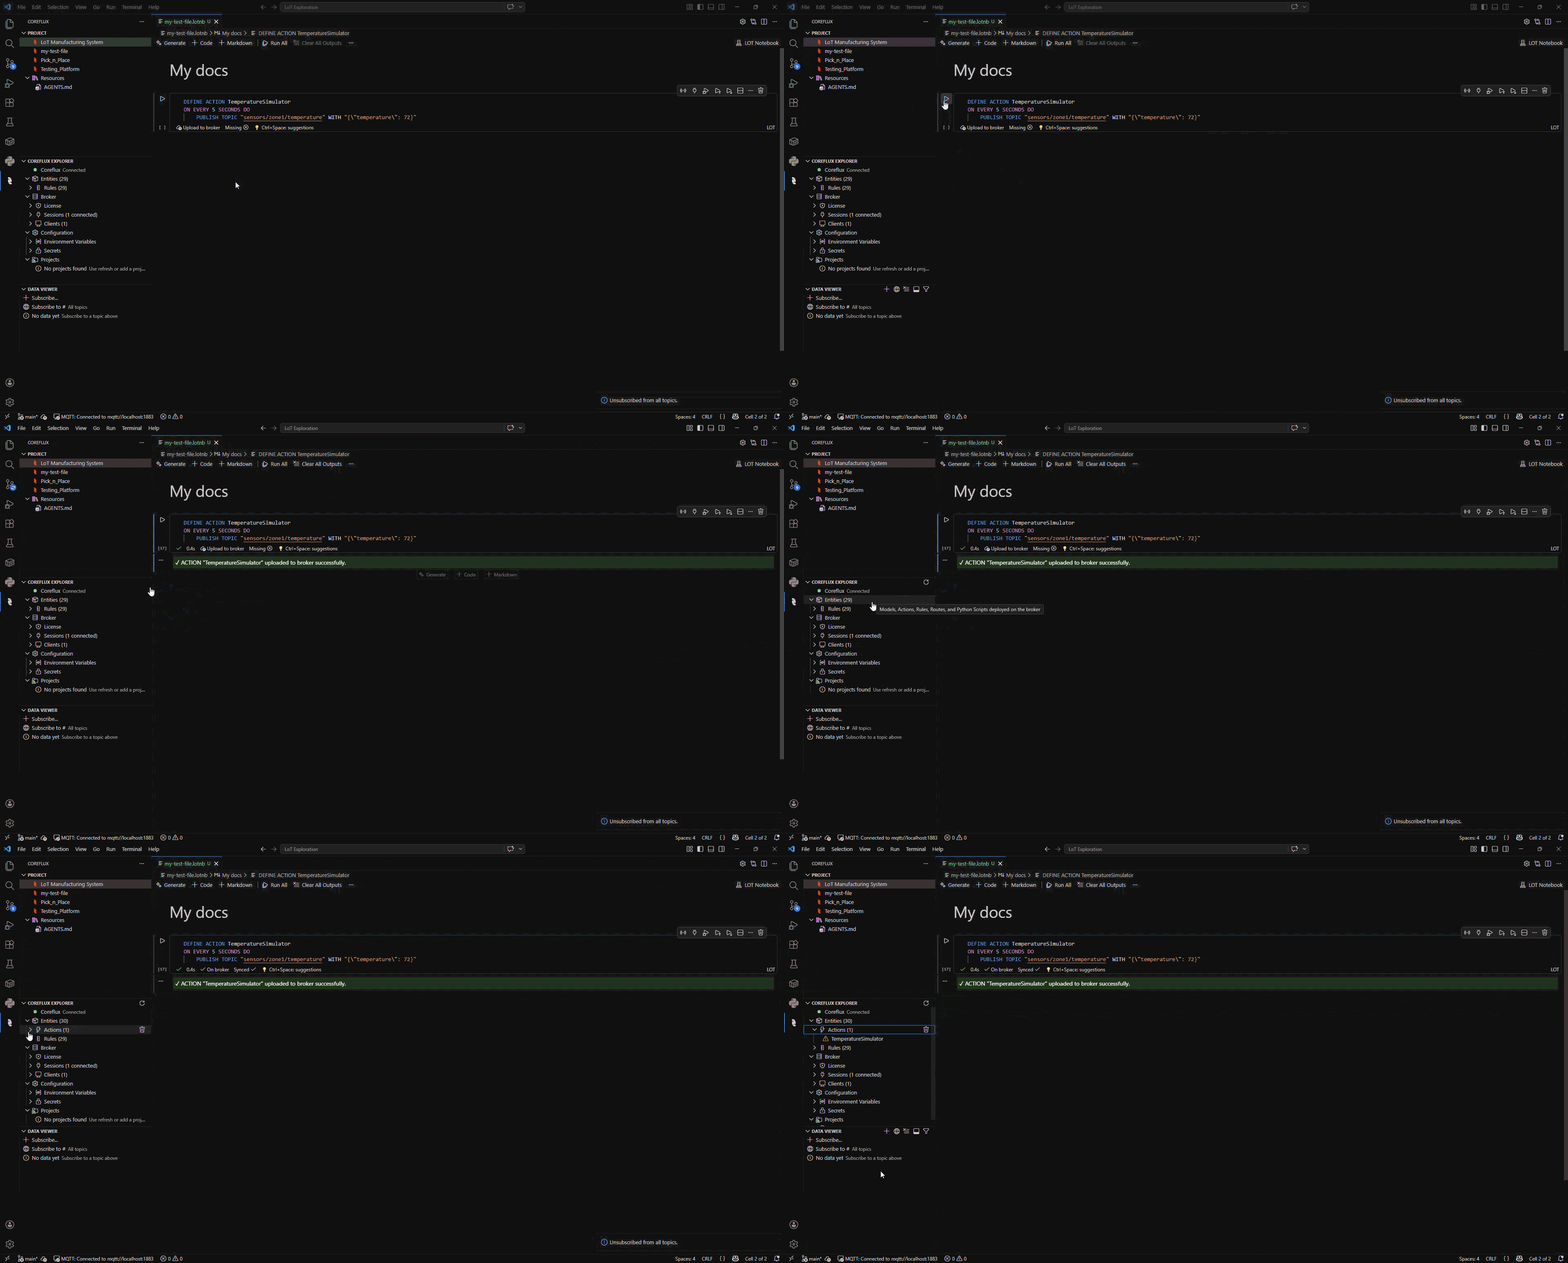
When you click Run on a LoT cell, the extension sends the definition to the broker and shows the result directly below the cell.
Animated walkthrough of clicking the Run button to deploy the action to the broker

Running a cell to deploy a LoT definition to the broker

How to Use a LoT Notebook

Cell execution, commands, broker topics, and troubleshooting accordions.

Introduction to LoT

What LoT is, how it runs in the broker, and simple examples to build on.
Last modified on May 21, 2026