> ## Documentation Index
> Fetch the complete documentation index at: https://docs.coreflux.org/llms.txt
> Use this file to discover all available pages before exploring further.
# Build Your First Dashboard
> From a topic in the Data Viewer to a live, shareable panel — in about ten minutes.
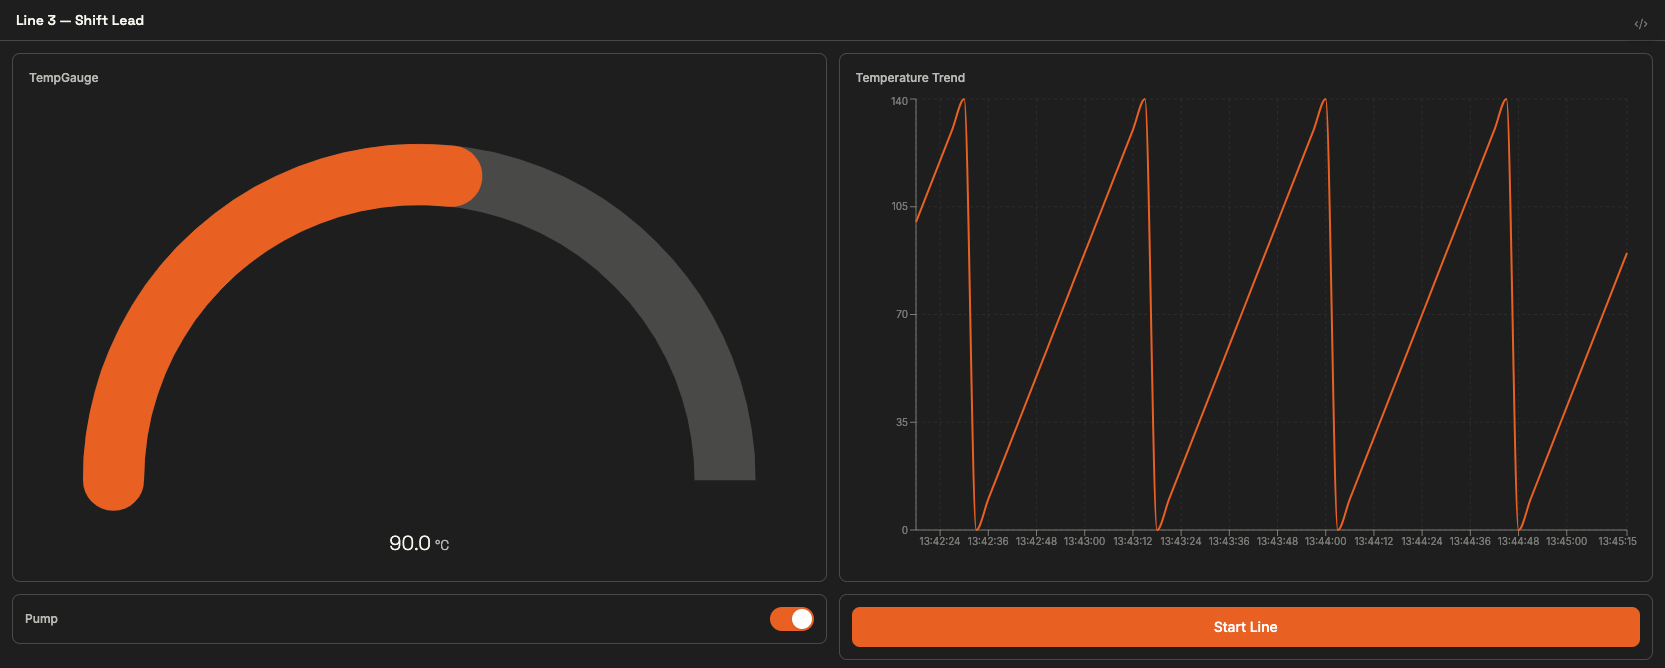 By the end of this guide you'll have a live monitoring panel with a gauge, a live trend chart, a control, and an action wired to it — open and shareable on a second screen. Everything runs on data you generate yourself, so you can follow along even on a fresh broker.
**Like assembling a control room one instrument at a time.** You'll bolt on one widget per step, watch it come alive immediately, and ship the finished console at the end.
So your widgets have something to show, deploy a small **LoT Action** that publishes a changing temperature and machine status every few seconds. Open the **LoT Editor** in the HUB, paste this, and deploy:
```lot wrap theme={"theme":"css-variables","languages":{"custom":["/languages/lot.json"]}}
DEFINE ACTION SimulateSensorData
ON EVERY 3 SECONDS DO
IF GET TOPIC "sim/counter" == EMPTY THEN
KEEP TOPIC "sim/counter" WITH 0
SET "n" WITH (GET TOPIC "sim/counter" AS INT)
SET "n" WITH ({n} + 10)
IF {n} > 140 THEN
SET "n" WITH 0
KEEP TOPIC "sim/counter" WITH {n}
PUBLISH TOPIC "sensor/temperature" WITH {n}
IF {n} > 100 THEN
PUBLISH TOPIC "machine/status" WITH "stopped"
ELSE
PUBLISH TOPIC "machine/status" WITH "running"
```
This ramps `sensor/temperature` from 0 to 140 and flips `machine/status` between `running` and `stopped` — enough to move a gauge past its threshold and draw a live trend line.
**Prefer to drive it by hand?** Skip the Action and instead publish manually in the [Data Viewer](/hub/mqtt/data-viewer): send `sensor/temperature` a number like `82`, and `machine/status` the text `running` or `stopped`.
Open the **Data Viewer** and confirm `sensor/temperature` is updating with a numeric payload. Note the payload shape: a plain number binds directly; a JSON object would need `JSON_PATH` later.
By the end of this guide you'll have a live monitoring panel with a gauge, a live trend chart, a control, and an action wired to it — open and shareable on a second screen. Everything runs on data you generate yourself, so you can follow along even on a fresh broker.
**Like assembling a control room one instrument at a time.** You'll bolt on one widget per step, watch it come alive immediately, and ship the finished console at the end.
So your widgets have something to show, deploy a small **LoT Action** that publishes a changing temperature and machine status every few seconds. Open the **LoT Editor** in the HUB, paste this, and deploy:
```lot wrap theme={"theme":"css-variables","languages":{"custom":["/languages/lot.json"]}}
DEFINE ACTION SimulateSensorData
ON EVERY 3 SECONDS DO
IF GET TOPIC "sim/counter" == EMPTY THEN
KEEP TOPIC "sim/counter" WITH 0
SET "n" WITH (GET TOPIC "sim/counter" AS INT)
SET "n" WITH ({n} + 10)
IF {n} > 140 THEN
SET "n" WITH 0
KEEP TOPIC "sim/counter" WITH {n}
PUBLISH TOPIC "sensor/temperature" WITH {n}
IF {n} > 100 THEN
PUBLISH TOPIC "machine/status" WITH "stopped"
ELSE
PUBLISH TOPIC "machine/status" WITH "running"
```
This ramps `sensor/temperature` from 0 to 140 and flips `machine/status` between `running` and `stopped` — enough to move a gauge past its threshold and draw a live trend line.
**Prefer to drive it by hand?** Skip the Action and instead publish manually in the [Data Viewer](/hub/mqtt/data-viewer): send `sensor/temperature` a number like `82`, and `machine/status` the text `running` or `stopped`.
Open the **Data Viewer** and confirm `sensor/temperature` is updating with a numeric payload. Note the payload shape: a plain number binds directly; a JSON object would need `JSON_PATH` later.
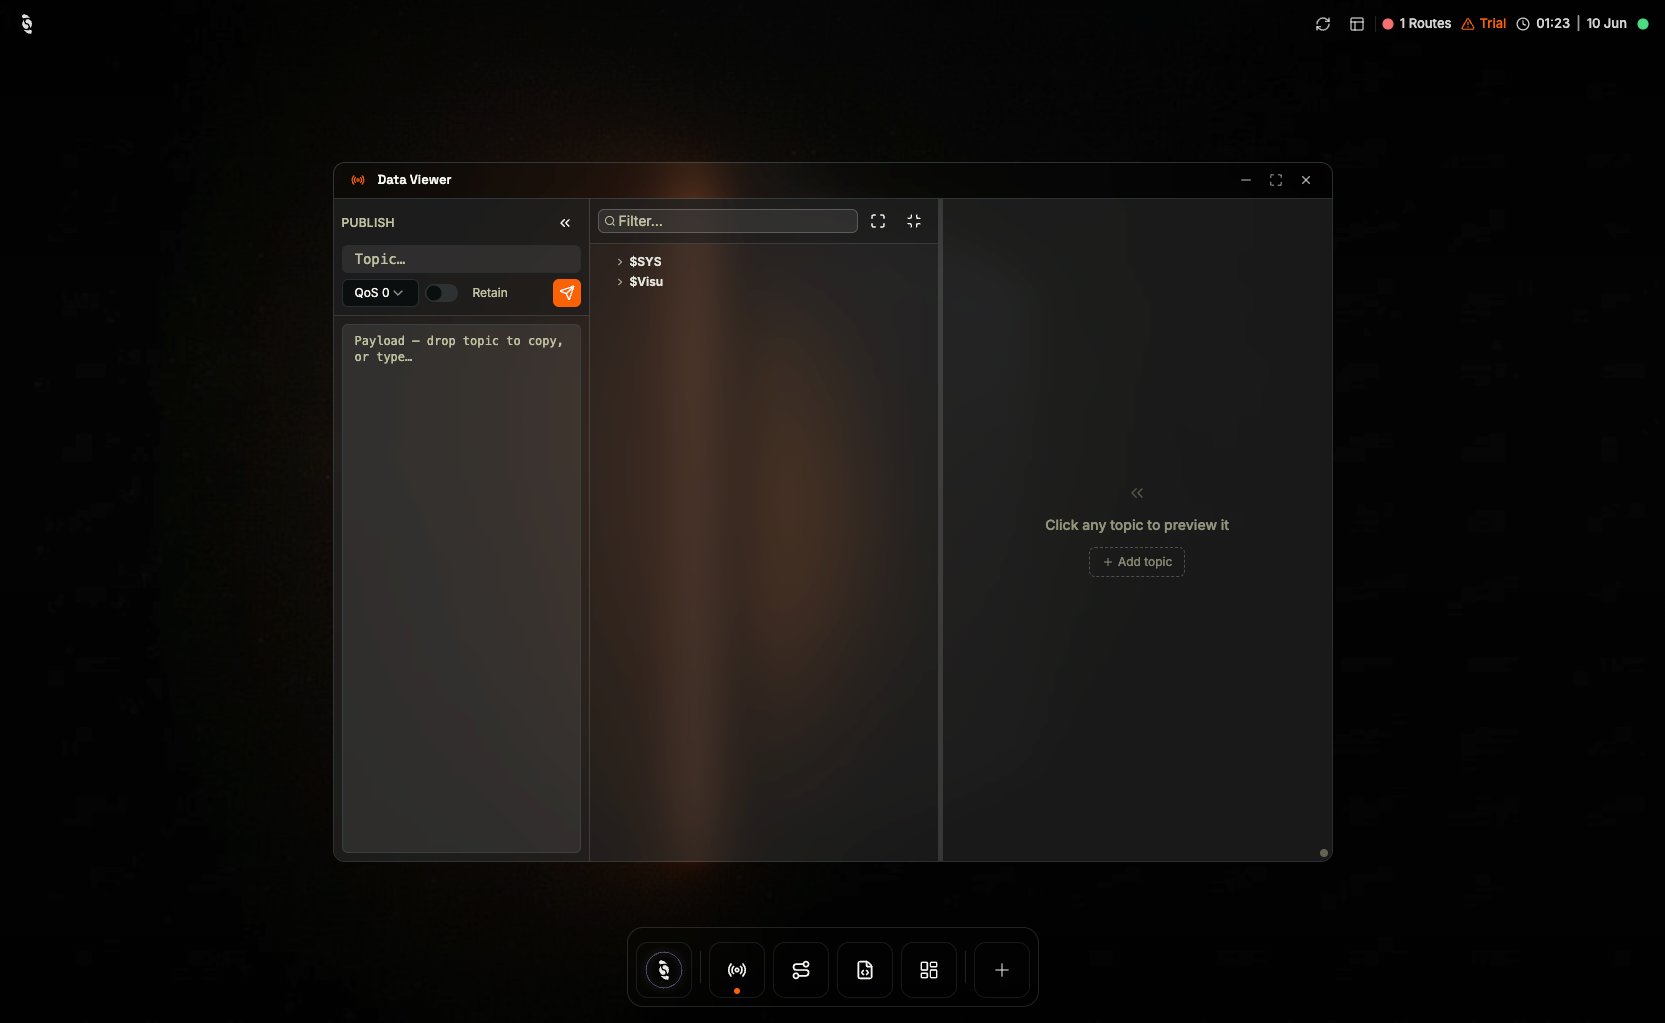 Open **Dashboards**, click **Create new panel**, and start from this skeleton. The Dashboard Manager opens the panel definition next to its live result:
```lot wrap theme={"theme":"css-variables","languages":{"custom":["/languages/lot.json"]}}
DEFINE PANEL Line3ShiftLead
WITH VISIBILITY PUBLIC
WITH STATE PUBLISHED
WITH TITLE "Line 3 — Shift Lead"
WITH LAYOUT "grid" COLUMNS 2
```
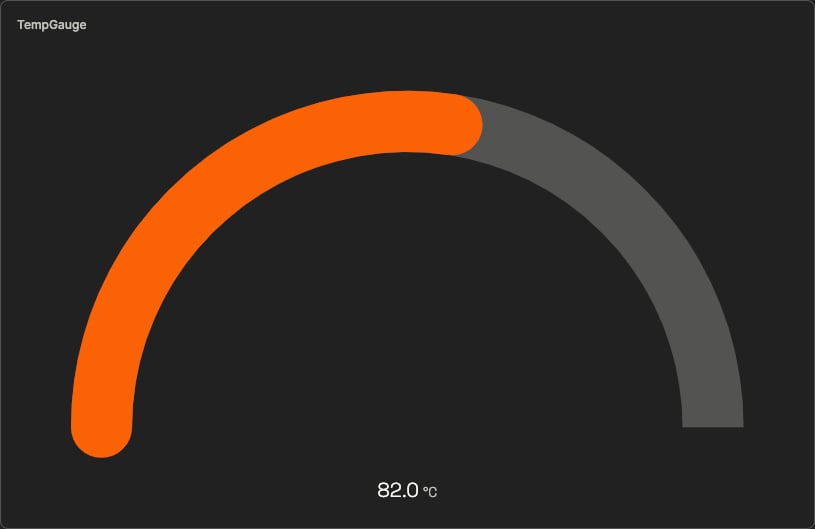
Add a **gauge** bound to `sensor/temperature`, with a range, a unit, and a warning threshold. The panel so far — the new gauge component is highlighted:
```lot wrap focus={7-11} theme={"theme":"css-variables","languages":{"custom":["/languages/lot.json"]}}
DEFINE PANEL Line3ShiftLead
WITH VISIBILITY PUBLIC
WITH STATE PUBLISHED
WITH TITLE "Line 3 — Shift Lead"
WITH LAYOUT "grid" COLUMNS 2
ADD COMPONENT "TempGauge" WITH TYPE "gauge"
SET RANGE FROM 0 TO 150
SET UNIT "°C"
BIND VALUE TO TOPIC "sensor/temperature"
ADD THRESHOLD AT 100 WITH COLOR "warning"
```
Save — the needle starts moving immediately. That's the live binding at work.
Open **Dashboards**, click **Create new panel**, and start from this skeleton. The Dashboard Manager opens the panel definition next to its live result:
```lot wrap theme={"theme":"css-variables","languages":{"custom":["/languages/lot.json"]}}
DEFINE PANEL Line3ShiftLead
WITH VISIBILITY PUBLIC
WITH STATE PUBLISHED
WITH TITLE "Line 3 — Shift Lead"
WITH LAYOUT "grid" COLUMNS 2
```
Add a **gauge** bound to `sensor/temperature`, with a range, a unit, and a warning threshold. The panel so far — the new gauge component is highlighted:
```lot wrap focus={7-11} theme={"theme":"css-variables","languages":{"custom":["/languages/lot.json"]}}
DEFINE PANEL Line3ShiftLead
WITH VISIBILITY PUBLIC
WITH STATE PUBLISHED
WITH TITLE "Line 3 — Shift Lead"
WITH LAYOUT "grid" COLUMNS 2
ADD COMPONENT "TempGauge" WITH TYPE "gauge"
SET RANGE FROM 0 TO 150
SET UNIT "°C"
BIND VALUE TO TOPIC "sensor/temperature"
ADD THRESHOLD AT 100 WITH COLOR "warning"
```
Save — the needle starts moving immediately. That's the live binding at work.
 The gauge shows *now*; a chart shows *the last few minutes*. Open the **AI Assistant** and ask:
> "Add a live chart to my Line 3 panel that trends `sensor/temperature` over time."
Review what it added in the Dashboard Manager — the panel now reads:
```lot wrap focus={13-16} theme={"theme":"css-variables","languages":{"custom":["/languages/lot.json"]}}
DEFINE PANEL Line3ShiftLead
WITH VISIBILITY PUBLIC
WITH STATE PUBLISHED
WITH TITLE "Line 3 — Shift Lead"
WITH LAYOUT "grid" COLUMNS 2
ADD COMPONENT "TempGauge" WITH TYPE "gauge"
SET RANGE FROM 0 TO 150
SET UNIT "°C"
BIND VALUE TO TOPIC "sensor/temperature"
ADD THRESHOLD AT 100 WITH COLOR "warning"
ADD COMPONENT "TempTrend" WITH TYPE "realtime-chart"
SET LABEL "Temperature Trend"
SET UNIT "°C"
BIND VALUE TO TOPIC "sensor/temperature"
```
The `realtime-chart` accumulates every published value into a trend — with the simulator from step 1 running, the line starts drawing itself within seconds.
Add a **toggle** that tracks the live pump state — it flips the moment the bound topic changes. Publish `true` or `false` to `zone1/pump/state` in the Data Viewer to see it move:
```lot wrap focus={18-20} theme={"theme":"css-variables","languages":{"custom":["/languages/lot.json"]}}
DEFINE PANEL Line3ShiftLead
WITH VISIBILITY PUBLIC
WITH STATE PUBLISHED
WITH TITLE "Line 3 — Shift Lead"
WITH LAYOUT "grid" COLUMNS 2
ADD COMPONENT "TempGauge" WITH TYPE "gauge"
SET RANGE FROM 0 TO 150
SET UNIT "°C"
BIND VALUE TO TOPIC "sensor/temperature"
ADD THRESHOLD AT 100 WITH COLOR "warning"
ADD COMPONENT "TempTrend" WITH TYPE "realtime-chart"
SET LABEL "Temperature Trend"
SET UNIT "°C"
BIND VALUE TO TOPIC "sensor/temperature"
ADD COMPONENT "PumpToggle" WITH TYPE "toggle"
SET LABEL "Pump"
BIND STATE TO TOPIC "zone1/pump/state"
```
Events and actions are what make a panel *do* things, not just show them. Add a **button** that publishes a start command when clicked:
```lot wrap focus={22-25} theme={"theme":"css-variables","languages":{"custom":["/languages/lot.json"]}}
DEFINE PANEL Line3ShiftLead
WITH VISIBILITY PUBLIC
WITH STATE PUBLISHED
WITH TITLE "Line 3 — Shift Lead"
WITH LAYOUT "grid" COLUMNS 2
ADD COMPONENT "TempGauge" WITH TYPE "gauge"
SET RANGE FROM 0 TO 150
SET UNIT "°C"
BIND VALUE TO TOPIC "sensor/temperature"
ADD THRESHOLD AT 100 WITH COLOR "warning"
ADD COMPONENT "TempTrend" WITH TYPE "realtime-chart"
SET LABEL "Temperature Trend"
SET UNIT "°C"
BIND VALUE TO TOPIC "sensor/temperature"
ADD COMPONENT "PumpToggle" WITH TYPE "toggle"
SET LABEL "Pump"
BIND STATE TO TOPIC "zone1/pump/state"
ADD COMPONENT "StartButton" WITH TYPE "button"
SET LABEL "Start Line"
ON CLICK DO
PUBLISH TOPIC "line3/commands/start" WITH 1
```
Watch it work: subscribe to `line3/commands/start` in the [Data Viewer](/hub/mqtt/data-viewer), click the button, and the `1` arrives instantly.
The full set of events (clicks, changes, thresholds) and actions (publish, navigate, invoke, trigger) is in [Actions & Events](/latest/lot-language/panels/actions-events).
Save, and the console is complete — verify the labels and ranges; operators will rely on this screen.
In the Dashboard Manager, hover the panel row and click **Broadcast in new tab**. Copy the URL into any browser — a wall TV, a tablet, a kiosk. Same live data, no HUB access required.
## The complete panel
Everything from the steps above in one copy-paste definition:
```lot wrap theme={"theme":"css-variables","languages":{"custom":["/languages/lot.json"]}}
DEFINE PANEL Line3ShiftLead
WITH VISIBILITY PUBLIC
WITH STATE PUBLISHED
WITH TITLE "Line 3 — Shift Lead"
WITH LAYOUT "grid" COLUMNS 2
ADD COMPONENT "TempGauge" WITH TYPE "gauge"
SET RANGE FROM 0 TO 150
SET UNIT "°C"
BIND VALUE TO TOPIC "sensor/temperature"
ADD THRESHOLD AT 100 WITH COLOR "warning"
ADD COMPONENT "TempTrend" WITH TYPE "realtime-chart"
SET LABEL "Temperature Trend"
SET UNIT "°C"
BIND VALUE TO TOPIC "sensor/temperature"
ADD COMPONENT "PumpToggle" WITH TYPE "toggle"
SET LABEL "Pump"
BIND STATE TO TOPIC "zone1/pump/state"
ADD COMPONENT "StartButton" WITH TYPE "button"
SET LABEL "Start Line"
ON CLICK DO
PUBLISH TOPIC "line3/commands/start" WITH 1
```
## Where to go next
Every widget, property, and bind target.
Ready-to-adapt recipes: KPI walls, control panels, and model-backed dashboards.
The gauge shows *now*; a chart shows *the last few minutes*. Open the **AI Assistant** and ask:
> "Add a live chart to my Line 3 panel that trends `sensor/temperature` over time."
Review what it added in the Dashboard Manager — the panel now reads:
```lot wrap focus={13-16} theme={"theme":"css-variables","languages":{"custom":["/languages/lot.json"]}}
DEFINE PANEL Line3ShiftLead
WITH VISIBILITY PUBLIC
WITH STATE PUBLISHED
WITH TITLE "Line 3 — Shift Lead"
WITH LAYOUT "grid" COLUMNS 2
ADD COMPONENT "TempGauge" WITH TYPE "gauge"
SET RANGE FROM 0 TO 150
SET UNIT "°C"
BIND VALUE TO TOPIC "sensor/temperature"
ADD THRESHOLD AT 100 WITH COLOR "warning"
ADD COMPONENT "TempTrend" WITH TYPE "realtime-chart"
SET LABEL "Temperature Trend"
SET UNIT "°C"
BIND VALUE TO TOPIC "sensor/temperature"
```
The `realtime-chart` accumulates every published value into a trend — with the simulator from step 1 running, the line starts drawing itself within seconds.
Add a **toggle** that tracks the live pump state — it flips the moment the bound topic changes. Publish `true` or `false` to `zone1/pump/state` in the Data Viewer to see it move:
```lot wrap focus={18-20} theme={"theme":"css-variables","languages":{"custom":["/languages/lot.json"]}}
DEFINE PANEL Line3ShiftLead
WITH VISIBILITY PUBLIC
WITH STATE PUBLISHED
WITH TITLE "Line 3 — Shift Lead"
WITH LAYOUT "grid" COLUMNS 2
ADD COMPONENT "TempGauge" WITH TYPE "gauge"
SET RANGE FROM 0 TO 150
SET UNIT "°C"
BIND VALUE TO TOPIC "sensor/temperature"
ADD THRESHOLD AT 100 WITH COLOR "warning"
ADD COMPONENT "TempTrend" WITH TYPE "realtime-chart"
SET LABEL "Temperature Trend"
SET UNIT "°C"
BIND VALUE TO TOPIC "sensor/temperature"
ADD COMPONENT "PumpToggle" WITH TYPE "toggle"
SET LABEL "Pump"
BIND STATE TO TOPIC "zone1/pump/state"
```
Events and actions are what make a panel *do* things, not just show them. Add a **button** that publishes a start command when clicked:
```lot wrap focus={22-25} theme={"theme":"css-variables","languages":{"custom":["/languages/lot.json"]}}
DEFINE PANEL Line3ShiftLead
WITH VISIBILITY PUBLIC
WITH STATE PUBLISHED
WITH TITLE "Line 3 — Shift Lead"
WITH LAYOUT "grid" COLUMNS 2
ADD COMPONENT "TempGauge" WITH TYPE "gauge"
SET RANGE FROM 0 TO 150
SET UNIT "°C"
BIND VALUE TO TOPIC "sensor/temperature"
ADD THRESHOLD AT 100 WITH COLOR "warning"
ADD COMPONENT "TempTrend" WITH TYPE "realtime-chart"
SET LABEL "Temperature Trend"
SET UNIT "°C"
BIND VALUE TO TOPIC "sensor/temperature"
ADD COMPONENT "PumpToggle" WITH TYPE "toggle"
SET LABEL "Pump"
BIND STATE TO TOPIC "zone1/pump/state"
ADD COMPONENT "StartButton" WITH TYPE "button"
SET LABEL "Start Line"
ON CLICK DO
PUBLISH TOPIC "line3/commands/start" WITH 1
```
Watch it work: subscribe to `line3/commands/start` in the [Data Viewer](/hub/mqtt/data-viewer), click the button, and the `1` arrives instantly.
The full set of events (clicks, changes, thresholds) and actions (publish, navigate, invoke, trigger) is in [Actions & Events](/latest/lot-language/panels/actions-events).
Save, and the console is complete — verify the labels and ranges; operators will rely on this screen.
In the Dashboard Manager, hover the panel row and click **Broadcast in new tab**. Copy the URL into any browser — a wall TV, a tablet, a kiosk. Same live data, no HUB access required.
## The complete panel
Everything from the steps above in one copy-paste definition:
```lot wrap theme={"theme":"css-variables","languages":{"custom":["/languages/lot.json"]}}
DEFINE PANEL Line3ShiftLead
WITH VISIBILITY PUBLIC
WITH STATE PUBLISHED
WITH TITLE "Line 3 — Shift Lead"
WITH LAYOUT "grid" COLUMNS 2
ADD COMPONENT "TempGauge" WITH TYPE "gauge"
SET RANGE FROM 0 TO 150
SET UNIT "°C"
BIND VALUE TO TOPIC "sensor/temperature"
ADD THRESHOLD AT 100 WITH COLOR "warning"
ADD COMPONENT "TempTrend" WITH TYPE "realtime-chart"
SET LABEL "Temperature Trend"
SET UNIT "°C"
BIND VALUE TO TOPIC "sensor/temperature"
ADD COMPONENT "PumpToggle" WITH TYPE "toggle"
SET LABEL "Pump"
BIND STATE TO TOPIC "zone1/pump/state"
ADD COMPONENT "StartButton" WITH TYPE "button"
SET LABEL "Start Line"
ON CLICK DO
PUBLISH TOPIC "line3/commands/start" WITH 1
```
## Where to go next
Every widget, property, and bind target.
Ready-to-adapt recipes: KPI walls, control panels, and model-backed dashboards.