> ## Documentation Index
> Fetch the complete documentation index at: https://docs.coreflux.org/llms.txt
> Use this file to discover all available pages before exploring further.
# UNS Viewer
> Explore your broker's topic namespace as a live hierarchy graph in the Coreflux HUB
 ## Why Use the UNS Viewer?
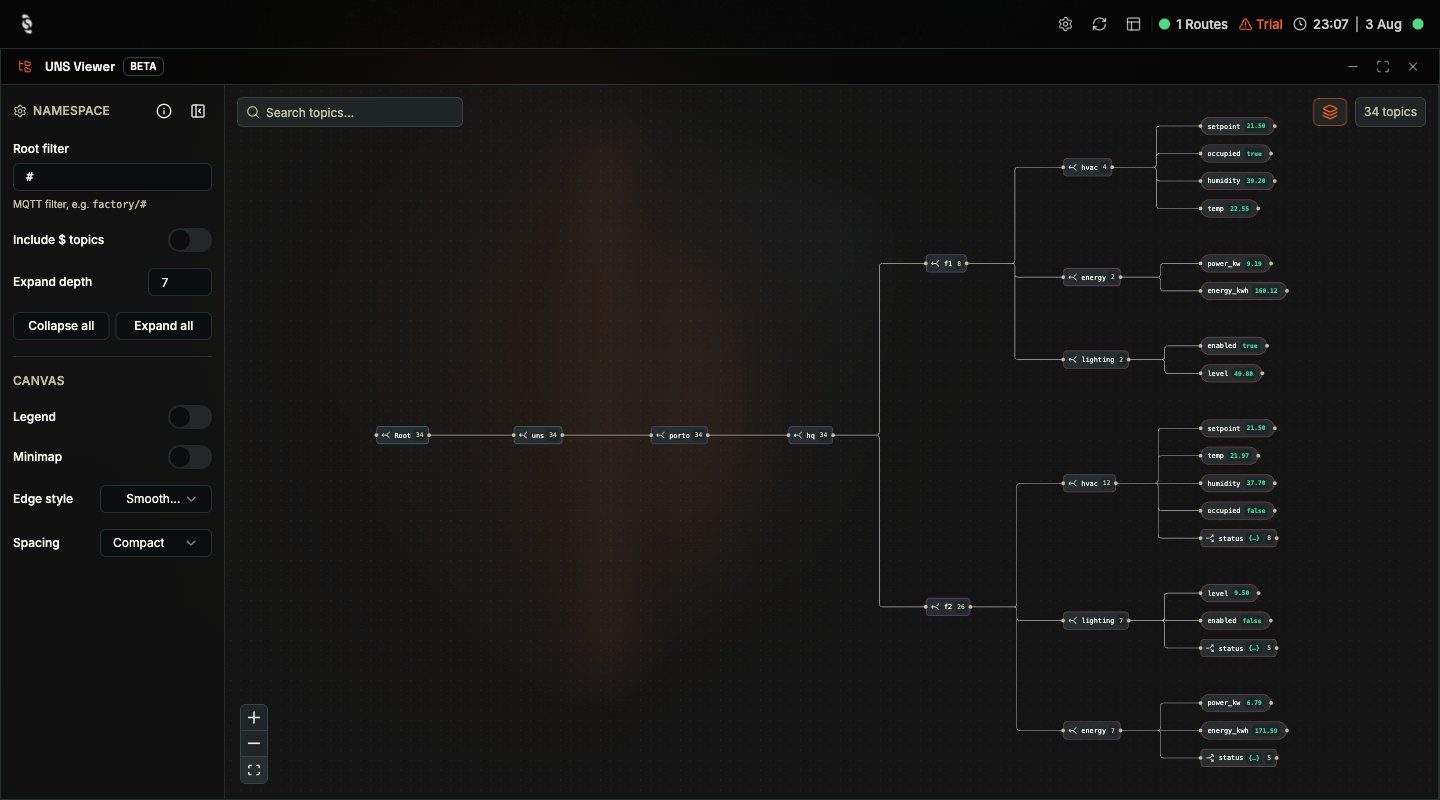
You have hundreds or thousands of topics on your broker and you need to understand their *shape* — how the namespace is organised, which levels exist, and where a given device or metric sits in the hierarchy. Reading that structure from a flat list of topic strings is slow and error-prone. The UNS Viewer draws your broker's namespace as a hierarchy graph, so you can see the structure at a glance instead of reconstructing it in your head.
The UNS Viewer carries a **`BETA`** badge in its window header. It is available for everyday use, but its controls and layout may still change between releases.
**Like a map of your factory instead of a list of street names.** A topic list tells you what exists; the namespace graph shows you how it all fits together.
## When to Use It
* **Understanding an unfamiliar broker** — Open the namespace and read the hierarchy top-down instead of guessing at topic conventions
* **Reviewing your namespace design** — Check that a new site, line, or device was published under the level you intended
* **Finding where a metric lives** — Search for a name and see which branch of the hierarchy it belongs to
* **Tracing a topic back to your logic** — Each leaf reports which Actions and Routes produce or consume it
* **Comparing several topics at once** — Select multiple topics and watch their values and history side by side
* **Spotting activity** — Live pulses show which parts of the namespace are actually receiving traffic
***
## Accessing the UNS Viewer
Select **UNS Viewer** in the HUB dock. The window opens with the namespace already built from the topics the HUB has seen, and a `N topics` badge in the top-right corner reports how many leaf topics are currently in scope.
## Reading the Graph
The canvas draws two kinds of node:
| Node | Shape | Meaning |
| ------------------ | ------- | -------------------------------------------------------------------------------------------------------------------- |
| **Namespace node** | Square | A level in the hierarchy. Carries a count of everything beneath it, and a chevron to expand or collapse its children |
| **Leaf topic** | Rounded | An actual MQTT topic. Shows its current value inline |
Colour and motion carry meaning too, and the **Legend** toggle puts a key on the canvas while you are learning the vocabulary:
* **Live value** — a green pulse means a message just arrived on that topic
* **Activity pulse** — a green glow on a namespace node shows aggregated traffic somewhere below it
* **Search match** — an amber ring marks topics matching your current search
Only leaf topics carry payloads. Selecting a namespace node reports `No message at this time`, because the values live on its children.
## Navigating the Namespace
The **NAMESPACE** section of the left rail controls how much of the tree is drawn:
| Control | What it does |
| --------------------------------- | -------------------------------------------------------------------------------------------------- |
| **Root filter** | An MQTT filter that scopes the whole view, `#` by default. The `N topics` badge follows the filter |
| **Include \$ topics** | Brings broker-internal `$SYS` and `$Visu` topics into the graph, which are hidden by default |
| **Expand depth** | How many levels are expanded when the graph is built. Defaults to `3` |
| **Collapse all** / **Expand all** | Collapse the whole tree, or expand every level at once |
The **Root filter** applies when you press **Enter** — typing a filter alone does not redraw the graph.
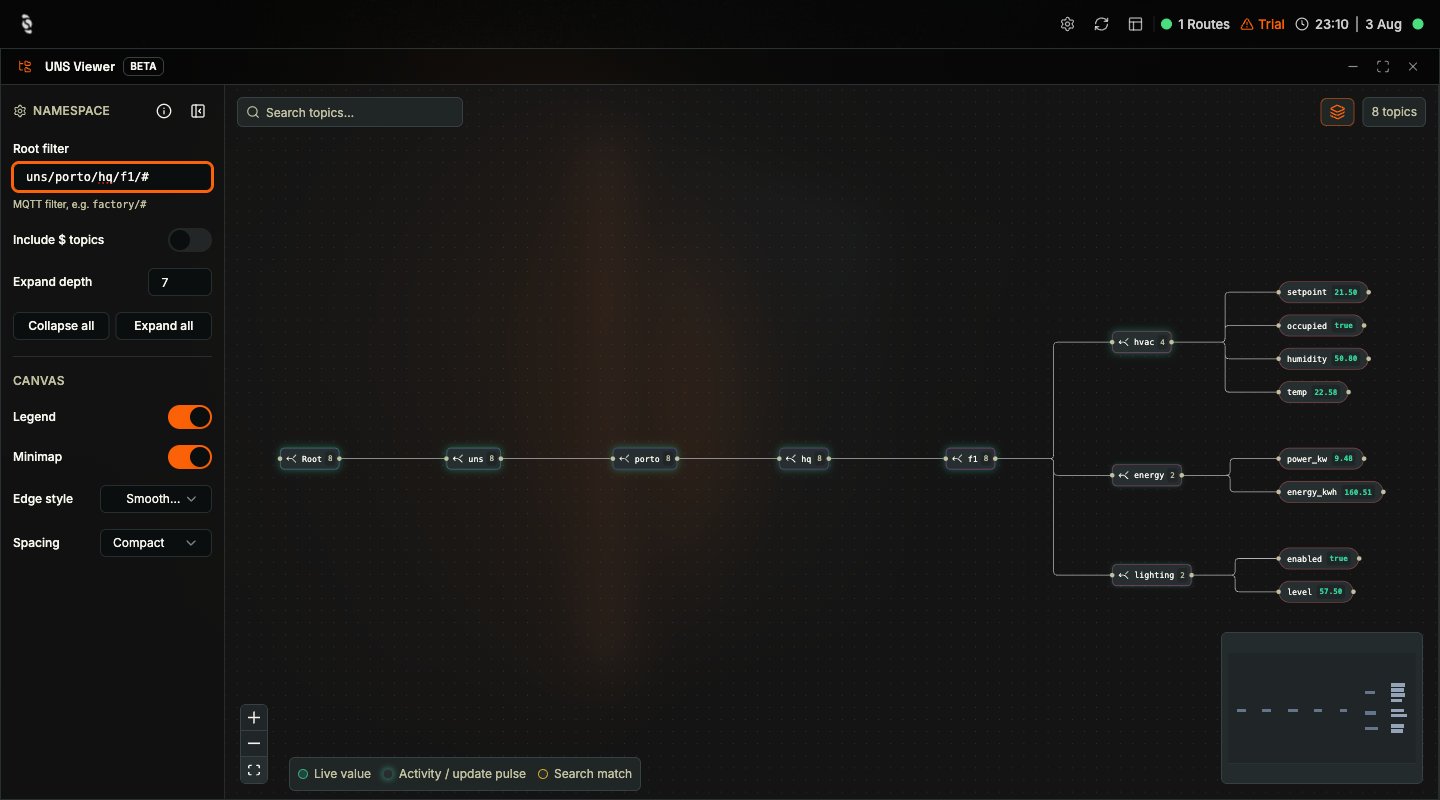
On a large namespace, narrowing the root filter to a subtree such as `uns/porto/hq/f1/#` is the fastest way to keep the graph readable.
The **Search topics** box highlights matching topics in place with an amber ring rather than filtering the graph, so you keep the surrounding structure as context while you locate something.
## Why Use the UNS Viewer?
You have hundreds or thousands of topics on your broker and you need to understand their *shape* — how the namespace is organised, which levels exist, and where a given device or metric sits in the hierarchy. Reading that structure from a flat list of topic strings is slow and error-prone. The UNS Viewer draws your broker's namespace as a hierarchy graph, so you can see the structure at a glance instead of reconstructing it in your head.
The UNS Viewer carries a **`BETA`** badge in its window header. It is available for everyday use, but its controls and layout may still change between releases.
**Like a map of your factory instead of a list of street names.** A topic list tells you what exists; the namespace graph shows you how it all fits together.
## When to Use It
* **Understanding an unfamiliar broker** — Open the namespace and read the hierarchy top-down instead of guessing at topic conventions
* **Reviewing your namespace design** — Check that a new site, line, or device was published under the level you intended
* **Finding where a metric lives** — Search for a name and see which branch of the hierarchy it belongs to
* **Tracing a topic back to your logic** — Each leaf reports which Actions and Routes produce or consume it
* **Comparing several topics at once** — Select multiple topics and watch their values and history side by side
* **Spotting activity** — Live pulses show which parts of the namespace are actually receiving traffic
***
## Accessing the UNS Viewer
Select **UNS Viewer** in the HUB dock. The window opens with the namespace already built from the topics the HUB has seen, and a `N topics` badge in the top-right corner reports how many leaf topics are currently in scope.
## Reading the Graph
The canvas draws two kinds of node:
| Node | Shape | Meaning |
| ------------------ | ------- | -------------------------------------------------------------------------------------------------------------------- |
| **Namespace node** | Square | A level in the hierarchy. Carries a count of everything beneath it, and a chevron to expand or collapse its children |
| **Leaf topic** | Rounded | An actual MQTT topic. Shows its current value inline |
Colour and motion carry meaning too, and the **Legend** toggle puts a key on the canvas while you are learning the vocabulary:
* **Live value** — a green pulse means a message just arrived on that topic
* **Activity pulse** — a green glow on a namespace node shows aggregated traffic somewhere below it
* **Search match** — an amber ring marks topics matching your current search
Only leaf topics carry payloads. Selecting a namespace node reports `No message at this time`, because the values live on its children.
## Navigating the Namespace
The **NAMESPACE** section of the left rail controls how much of the tree is drawn:
| Control | What it does |
| --------------------------------- | -------------------------------------------------------------------------------------------------- |
| **Root filter** | An MQTT filter that scopes the whole view, `#` by default. The `N topics` badge follows the filter |
| **Include \$ topics** | Brings broker-internal `$SYS` and `$Visu` topics into the graph, which are hidden by default |
| **Expand depth** | How many levels are expanded when the graph is built. Defaults to `3` |
| **Collapse all** / **Expand all** | Collapse the whole tree, or expand every level at once |
The **Root filter** applies when you press **Enter** — typing a filter alone does not redraw the graph.
On a large namespace, narrowing the root filter to a subtree such as `uns/porto/hq/f1/#` is the fastest way to keep the graph readable.
The **Search topics** box highlights matching topics in place with an amber ring rather than filtering the graph, so you keep the surrounding structure as context while you locate something.
 ### Canvas options
The **CANVAS** section changes how the graph is drawn without changing what it contains:
| Option | Choices |
| -------------- | ----------------------------------------------------------------- |
| **Legend** | Show or hide the node and edge key |
| **Minimap** | Show or hide an overview map for staying oriented in large graphs |
| **Edge style** | Smooth step, Bezier, Step, or Straight |
| **Spacing** | Compact, Comfortable, or Spacious |
Zoom, pan, and a **fit-view** control sit at the bottom-left of the canvas. Fit the view after expanding or filtering — a freshly laid-out graph is often off-centre.
***
## Inspecting a Topic
Select a leaf topic to open the inspector on the right. It reports the topic's breadcrumb path, its live value, its history, and how it relates to the LoT running on your broker.
### Canvas options
The **CANVAS** section changes how the graph is drawn without changing what it contains:
| Option | Choices |
| -------------- | ----------------------------------------------------------------- |
| **Legend** | Show or hide the node and edge key |
| **Minimap** | Show or hide an overview map for staying oriented in large graphs |
| **Edge style** | Smooth step, Bezier, Step, or Straight |
| **Spacing** | Compact, Comfortable, or Spacious |
Zoom, pan, and a **fit-view** control sit at the bottom-left of the canvas. Fit the view after expanding or filtering — a freshly laid-out graph is often off-centre.
***
## Inspecting a Topic
Select a leaf topic to open the inspector on the right. It reports the topic's breadcrumb path, its live value, its history, and how it relates to the LoT running on your broker.
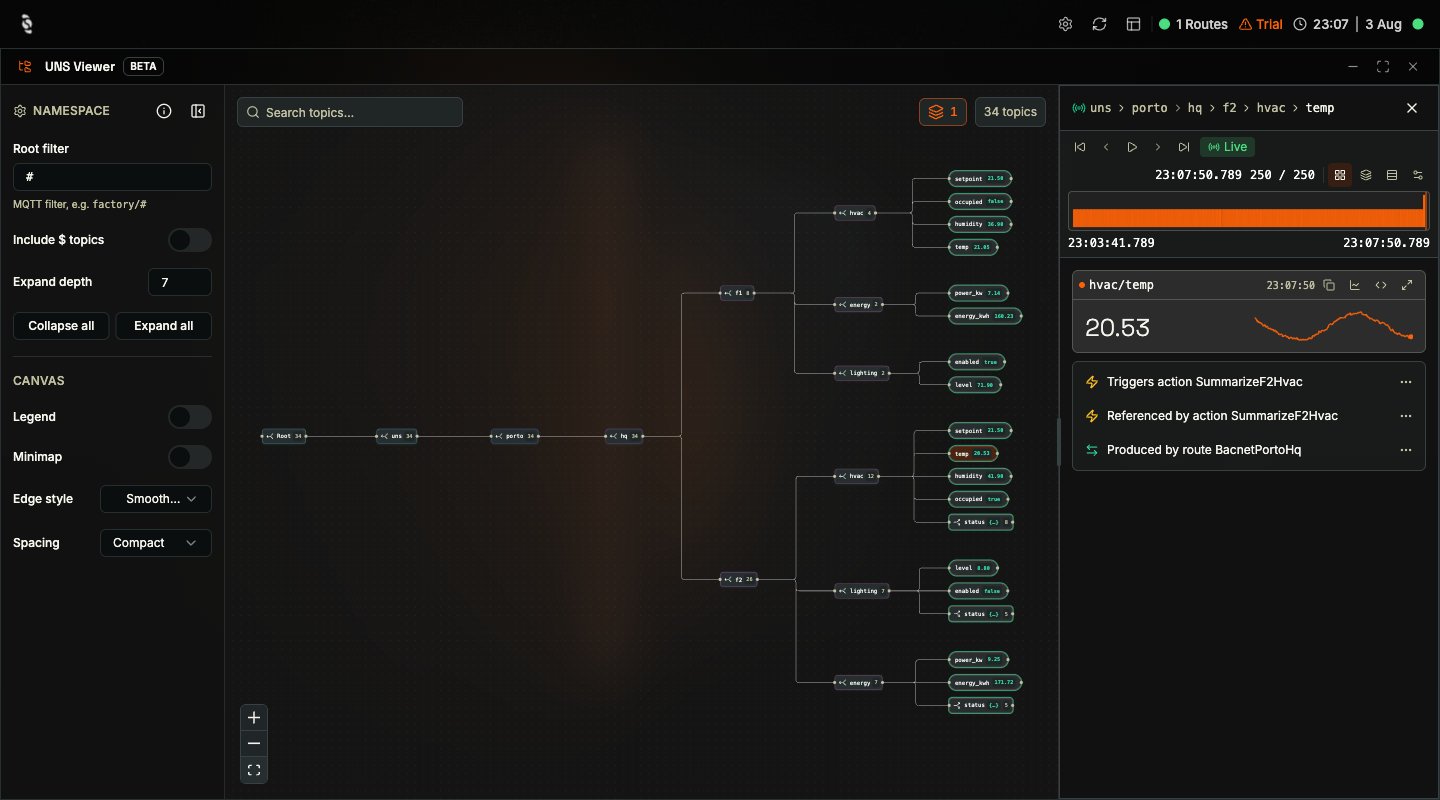 The inspector gives you:
* **A value card** with the current value and a **sparkline** of recent history
* **A message histogram** with the start and end timestamps of the buffered history
* **Playback controls** — step to first, previous, next, or last message, or play the history back
* **A `Live` toggle** that snaps to the latest message and resumes real-time updates
* **LoT cross-references** — which Actions the topic triggers, which reference it, and which Route produces it
Those cross-references are the bridge between your namespace and your logic. A topic written by a Route and consumed by an Action shows all three relationships, and a topic that nothing uses reports `Not referenced by any action or route.`
Cross-references answer "is anything actually using this topic?" — useful when cleaning up a namespace, or when confirming that a newly deployed Action really is wired to the topic you intended.
### Comparing several topics
Turn on **multi-select** in the top-right corner to keep more than one topic selected. Each selection becomes a removable chip carrying its own message count, the inspector header counts them, and the histogram merges every selected topic onto one timeline so you can line their behaviour up against each other. Press `Esc` to leave multi-select.
With multi-select off, a plain click replaces the current selection, while `Shift`, `Ctrl`, or `⌘` click adds to it.
***
## Namespace Best Practices
The UNS Viewer makes the consequences of namespace design visible, and the shape it draws is only as good as the topics you publish:
* **Keep the hierarchy consistent** — model your physical or organisational structure, so the graph reads like your plant
* **Use lowercase, stable, descriptive segment names** — and avoid renaming a level once it is in use
* **Publish state as retained messages** so late subscribers, including this viewer, get the current value
* **Prefer descriptive leaf metrics** over opaque blobs that have to be parsed downstream
* **Narrow the root filter** on large namespaces rather than fighting a graph with thousands of nodes
The viewer builds its tree from the topics the HUB has observed. A topic that has never published, and holds no retained value, cannot appear in the graph.
***
## Next Steps
See the Actions, Models, and Routes behind those topics as a dependency graph.
Read individual payloads, track topics as cards, and publish test messages.
The inspector gives you:
* **A value card** with the current value and a **sparkline** of recent history
* **A message histogram** with the start and end timestamps of the buffered history
* **Playback controls** — step to first, previous, next, or last message, or play the history back
* **A `Live` toggle** that snaps to the latest message and resumes real-time updates
* **LoT cross-references** — which Actions the topic triggers, which reference it, and which Route produces it
Those cross-references are the bridge between your namespace and your logic. A topic written by a Route and consumed by an Action shows all three relationships, and a topic that nothing uses reports `Not referenced by any action or route.`
Cross-references answer "is anything actually using this topic?" — useful when cleaning up a namespace, or when confirming that a newly deployed Action really is wired to the topic you intended.
### Comparing several topics
Turn on **multi-select** in the top-right corner to keep more than one topic selected. Each selection becomes a removable chip carrying its own message count, the inspector header counts them, and the histogram merges every selected topic onto one timeline so you can line their behaviour up against each other. Press `Esc` to leave multi-select.
With multi-select off, a plain click replaces the current selection, while `Shift`, `Ctrl`, or `⌘` click adds to it.
***
## Namespace Best Practices
The UNS Viewer makes the consequences of namespace design visible, and the shape it draws is only as good as the topics you publish:
* **Keep the hierarchy consistent** — model your physical or organisational structure, so the graph reads like your plant
* **Use lowercase, stable, descriptive segment names** — and avoid renaming a level once it is in use
* **Publish state as retained messages** so late subscribers, including this viewer, get the current value
* **Prefer descriptive leaf metrics** over opaque blobs that have to be parsed downstream
* **Narrow the root filter** on large namespaces rather than fighting a graph with thousands of nodes
The viewer builds its tree from the topics the HUB has observed. A topic that has never published, and holds no retained value, cannot appear in the graph.
***
## Next Steps
See the Actions, Models, and Routes behind those topics as a dependency graph.
Read individual payloads, track topics as cards, and publish test messages.