> ## Documentation Index
> Fetch the complete documentation index at: https://docs.coreflux.org/llms.txt
> Use this file to discover all available pages before exploring further.
# Common Patterns
> Ready-to-adapt panel recipes for the most frequent dashboard jobs.
 Each recipe is a complete, working panel. Copy it, swap the topics for yours, and adjust ranges and labels.
**Like starter dough.** Each recipe already works as-is — you don't build from scratch, you season: your topics, your ranges, your labels.
***
Five recipes, ordered from the smallest useful panel to data-layer integrations.
## Minimal monitoring panel
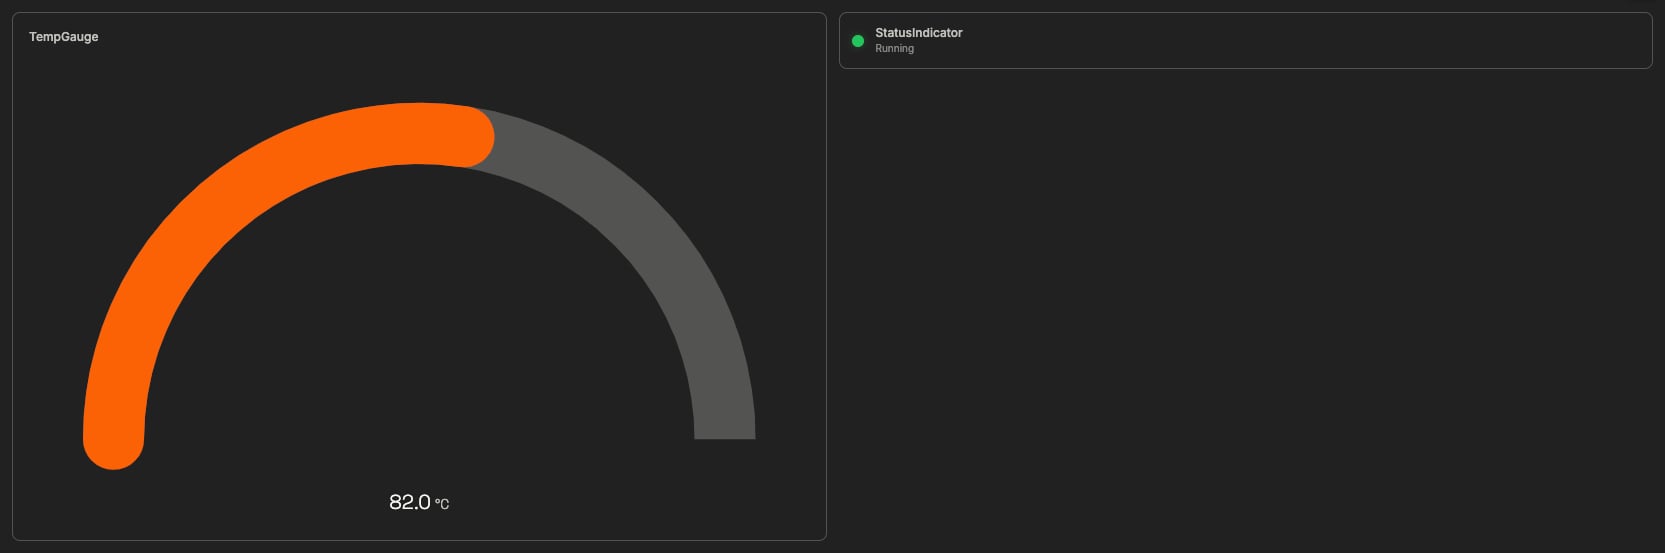
**Goal:** one signal, one status — the smallest useful dashboard.
Each recipe is a complete, working panel. Copy it, swap the topics for yours, and adjust ranges and labels.
**Like starter dough.** Each recipe already works as-is — you don't build from scratch, you season: your topics, your ranges, your labels.
***
Five recipes, ordered from the smallest useful panel to data-layer integrations.
## Minimal monitoring panel
**Goal:** one signal, one status — the smallest useful dashboard.
 ```lot wrap theme={"theme":"css-variables","languages":{"custom":["/languages/lot.json"]}}
DEFINE PANEL SensorMonitor
WITH VISIBILITY PUBLIC
WITH STATE PUBLISHED
WITH TITLE "Sensor Monitor"
WITH LAYOUT "grid" COLUMNS 2
ADD COMPONENT "TempGauge" WITH TYPE "gauge"
AT COLUMN 1 ROW 1
SET RANGE FROM 0 TO 150
SET UNIT "°C"
BIND VALUE TO TOPIC "sensor/temperature"
ADD THRESHOLD AT 100 WITH COLOR "warning"
ADD THRESHOLD AT 130 WITH COLOR "critical"
ADD COMPONENT "StatusIndicator" WITH TYPE "indicator"
AT COLUMN 2 ROW 1
BIND STATE TO TOPIC "machine/status"
SET ON_VALUE "running" WITH COLOR "green"
SET ON_VALUE "stopped" WITH COLOR "red"
SET SIZE "large"
```
**Adapt:** your topic names, the gauge range, the threshold levels.
## Live KPI dashboard
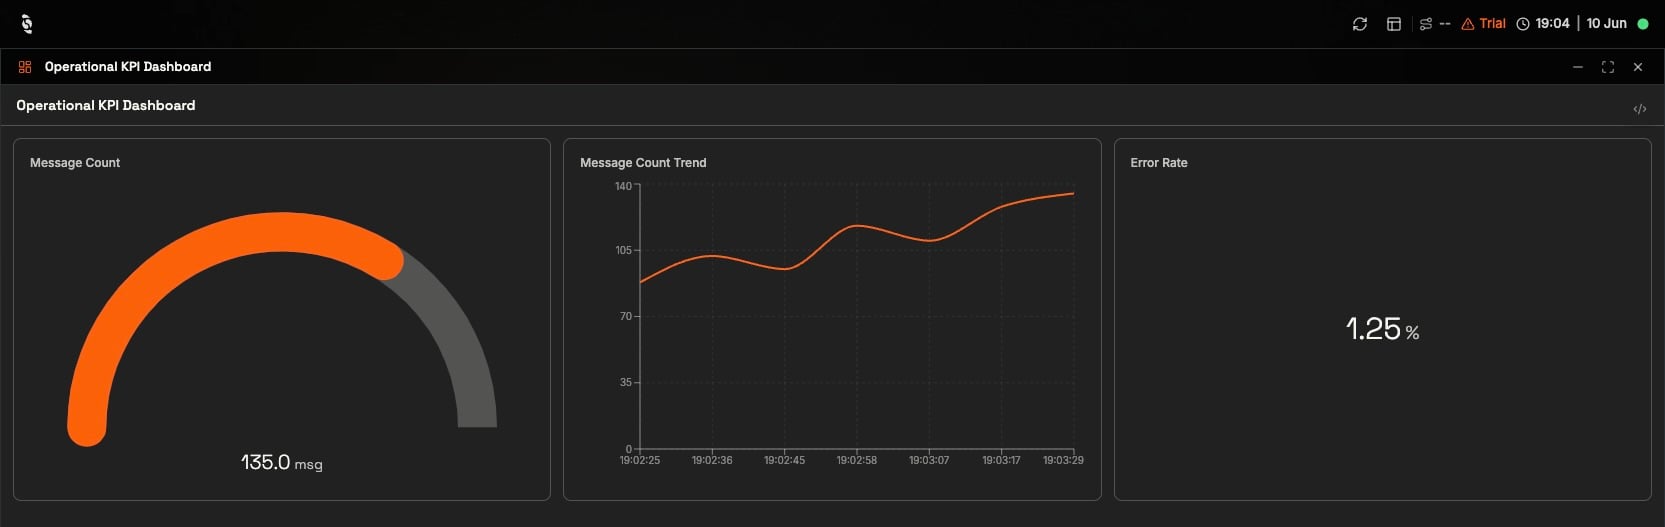
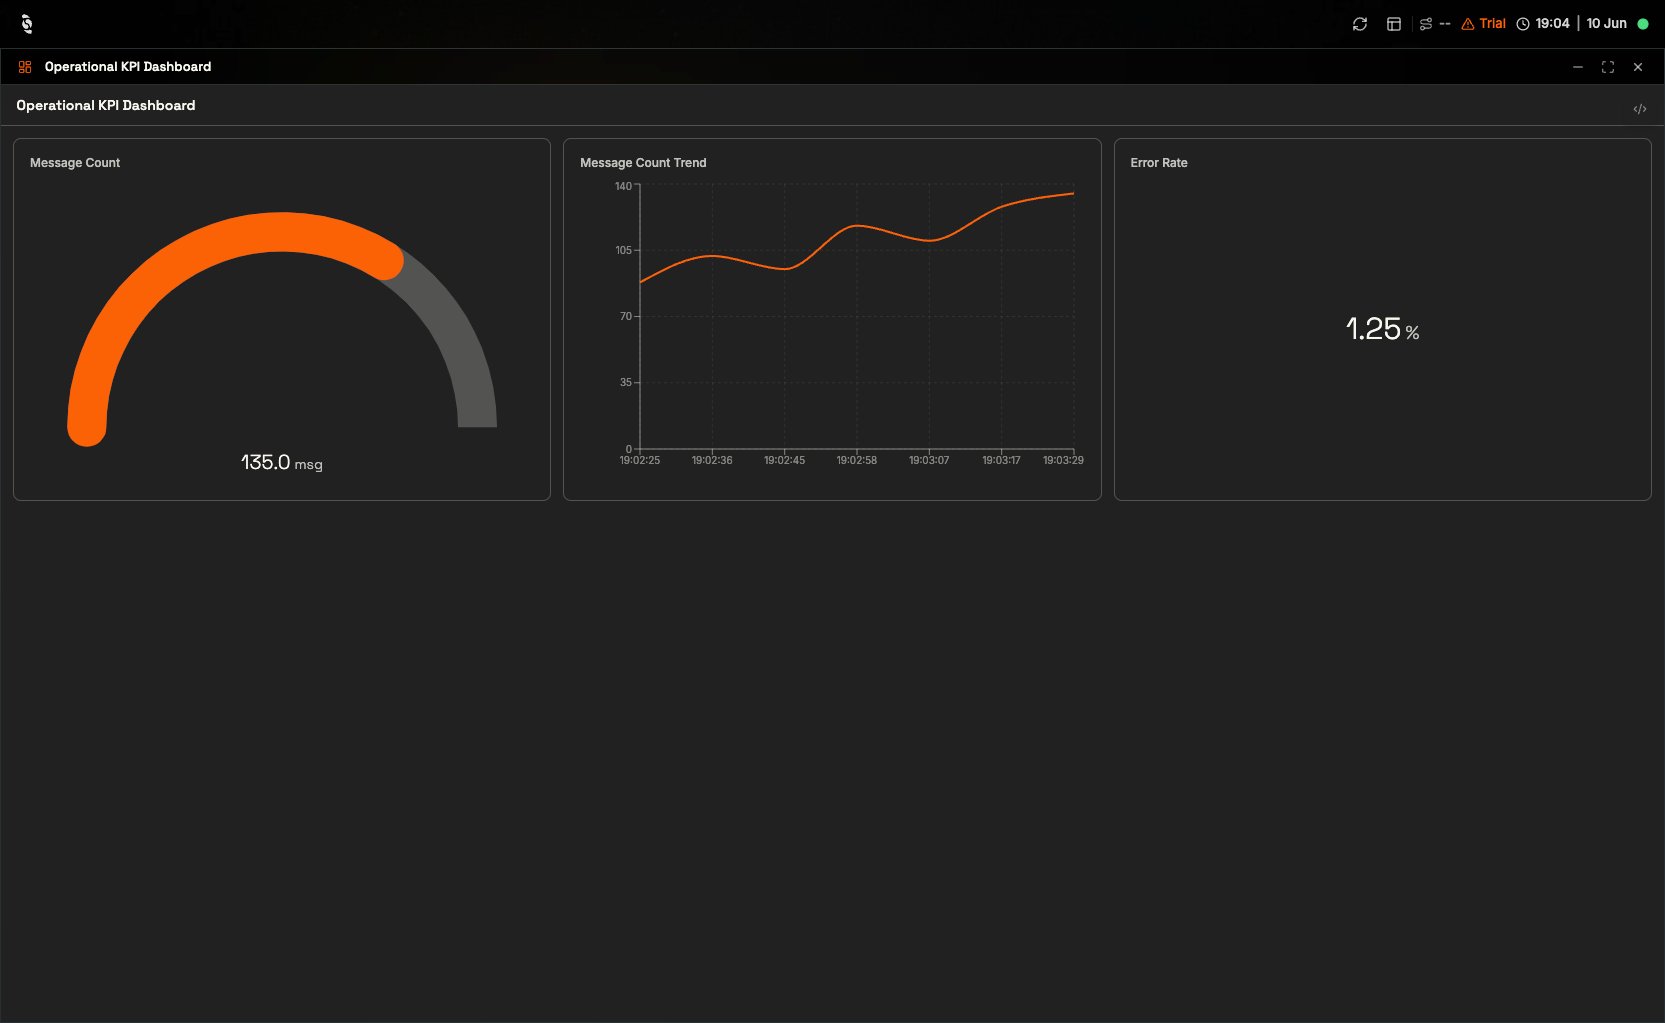
**Goal:** a wall screen with a headline number, its trend, and a secondary KPI.
```lot wrap theme={"theme":"css-variables","languages":{"custom":["/languages/lot.json"]}}
DEFINE PANEL SensorMonitor
WITH VISIBILITY PUBLIC
WITH STATE PUBLISHED
WITH TITLE "Sensor Monitor"
WITH LAYOUT "grid" COLUMNS 2
ADD COMPONENT "TempGauge" WITH TYPE "gauge"
AT COLUMN 1 ROW 1
SET RANGE FROM 0 TO 150
SET UNIT "°C"
BIND VALUE TO TOPIC "sensor/temperature"
ADD THRESHOLD AT 100 WITH COLOR "warning"
ADD THRESHOLD AT 130 WITH COLOR "critical"
ADD COMPONENT "StatusIndicator" WITH TYPE "indicator"
AT COLUMN 2 ROW 1
BIND STATE TO TOPIC "machine/status"
SET ON_VALUE "running" WITH COLOR "green"
SET ON_VALUE "stopped" WITH COLOR "red"
SET SIZE "large"
```
**Adapt:** your topic names, the gauge range, the threshold levels.
## Live KPI dashboard
**Goal:** a wall screen with a headline number, its trend, and a secondary KPI.
 ```lot wrap theme={"theme":"css-variables","languages":{"custom":["/languages/lot.json"]}}
DEFINE PANEL KpiDashboard
WITH VISIBILITY PUBLIC
WITH STATE PUBLISHED
WITH TITLE "Operational KPI Dashboard"
WITH LAYOUT "grid" COLUMNS 3
ADD COMPONENT "MessageCountGauge" WITH TYPE "gauge"
SET LABEL "Message Count"
SET RANGE FROM 0 TO 200
SET UNIT "msg"
BIND VALUE TO TOPIC "kpi/operational/messageCount"
ADD COMPONENT "MessageCountTrend" WITH TYPE "realtime-chart"
SET LABEL "Message Count Trend"
SET CHART_TYPE "line"
SET UNIT "msg"
BIND VALUE TO TOPIC "kpi/operational/messageCount"
SET SERIES_LABEL "Message Count"
ADD COMPONENT "ErrorRate" WITH TYPE "value"
SET LABEL "Error Rate"
SET UNIT "%"
SET DECIMALS 2
BIND VALUE TO TOPIC "kpi/operational/errorRate"
```
**Adapt:** share it on a TV via the panel URL — see [Dashboards in the HUB](/hub/dashboards/overview).
## Control panel
**Goal:** drive the line from the dashboard — buttons publish commands, a number field sets the speed, and a slider tracks the live feedback.
```lot wrap theme={"theme":"css-variables","languages":{"custom":["/languages/lot.json"]}}
DEFINE PANEL KpiDashboard
WITH VISIBILITY PUBLIC
WITH STATE PUBLISHED
WITH TITLE "Operational KPI Dashboard"
WITH LAYOUT "grid" COLUMNS 3
ADD COMPONENT "MessageCountGauge" WITH TYPE "gauge"
SET LABEL "Message Count"
SET RANGE FROM 0 TO 200
SET UNIT "msg"
BIND VALUE TO TOPIC "kpi/operational/messageCount"
ADD COMPONENT "MessageCountTrend" WITH TYPE "realtime-chart"
SET LABEL "Message Count Trend"
SET CHART_TYPE "line"
SET UNIT "msg"
BIND VALUE TO TOPIC "kpi/operational/messageCount"
SET SERIES_LABEL "Message Count"
ADD COMPONENT "ErrorRate" WITH TYPE "value"
SET LABEL "Error Rate"
SET UNIT "%"
SET DECIMALS 2
BIND VALUE TO TOPIC "kpi/operational/errorRate"
```
**Adapt:** share it on a TV via the panel URL — see [Dashboards in the HUB](/hub/dashboards/overview).
## Control panel
**Goal:** drive the line from the dashboard — buttons publish commands, a number field sets the speed, and a slider tracks the live feedback.
 ```lot wrap theme={"theme":"css-variables","languages":{"custom":["/languages/lot.json"]}}
DEFINE PANEL Zone1Control
WITH VISIBILITY PUBLIC
WITH STATE PUBLISHED
WITH TITLE "Zone 1 Control"
WITH LAYOUT "grid" COLUMNS 2
ADD COMPONENT "StartButton" WITH TYPE "button"
AT COLUMN 1 ROW 1
SET LABEL "Start Conveyor"
ON CLICK DO
PUBLISH TOPIC "zone1/conveyor/cmd/start" WITH 1
ADD COMPONENT "StopButton" WITH TYPE "button"
AT COLUMN 2 ROW 1
SET LABEL "Stop Conveyor"
SET STYLE "danger"
ON CLICK DO
PUBLISH TOPIC "zone1/conveyor/cmd/stop" WITH 1
ADD COMPONENT "SpeedSetpoint" WITH TYPE "number-field"
AT COLUMN 1 ROW 2
SET LABEL "Speed Setpoint (%)"
SET PLACEHOLDER "0"
ON CHANGE DO
PUBLISH TOPIC "zone1/conveyor/cmd/speed" WITH VALUE
ADD COMPONENT "LiveSpeed" WITH TYPE "slider"
AT COLUMN 2 ROW 2
SET RANGE FROM 0 TO 100
SET UNIT "%"
BIND VALUE TO TOPIC "zone1/conveyor/speed"
```
**Adapt:** the command topics (`cmd/...`) and the feedback topic (`speed`) — keeping them separate means the slider reflects what the line is actually doing, not just the last setpoint sent.
## Panel backed by a LoT Model
**Goal:** when a [Model](/latest/lot-language/models/overview) already aggregates your data layer, bind to its fields instead of raw topics.
**Known issue (current HUB build).** `BIND … TO MODEL` bindings do not receive data yet, and `SET MODEL … WITH VALUE` write-back from panel handlers does not update model fields — so this recipe cannot be shown rendering live values and the setpoint field cannot write back. The syntax below follows the spec; in the meantime, bind widgets to the model's source topics (or its output topic with `JSON_PATH`) and publish setpoints to those topics directly.
```lot wrap theme={"theme":"css-variables","languages":{"custom":["/languages/lot.json"]}}
DEFINE PANEL PumpDashboard
WITH VISIBILITY PUBLIC
WITH STATE PUBLISHED
WITH TITLE "Pump System"
WITH LAYOUT "grid" COLUMNS 3
ADD COMPONENT "FlowGauge" WITH TYPE "gauge"
BIND VALUE TO MODEL "PumpSystem.flow_rate"
SET UNIT "L/min"
SET RANGE FROM 0 TO 500
ADD COMPONENT "PressureDisplay" WITH TYPE "value"
BIND VALUE TO MODEL "PumpSystem.pressure"
SET UNIT "bar"
SET DECIMALS 2
ADD COMPONENT "PumpStatus" WITH TYPE "indicator"
BIND STATE TO MODEL "PumpSystem.running"
SET ON_VALUE "true" WITH COLOR "success"
SET ON_VALUE "false" WITH COLOR "muted"
SET SIZE "large"
ADD COMPONENT "FlowSetpoint" WITH TYPE "number-field"
SET LABEL "Flow Setpoint (L/min)"
SET PLACEHOLDER "0"
BIND VALUE TO MODEL "PumpSystem.setpoint"
```
## Next Steps
Walk through one of these panels end to end with live data.
Publish, share, and put any of these on a wall screen.
```lot wrap theme={"theme":"css-variables","languages":{"custom":["/languages/lot.json"]}}
DEFINE PANEL Zone1Control
WITH VISIBILITY PUBLIC
WITH STATE PUBLISHED
WITH TITLE "Zone 1 Control"
WITH LAYOUT "grid" COLUMNS 2
ADD COMPONENT "StartButton" WITH TYPE "button"
AT COLUMN 1 ROW 1
SET LABEL "Start Conveyor"
ON CLICK DO
PUBLISH TOPIC "zone1/conveyor/cmd/start" WITH 1
ADD COMPONENT "StopButton" WITH TYPE "button"
AT COLUMN 2 ROW 1
SET LABEL "Stop Conveyor"
SET STYLE "danger"
ON CLICK DO
PUBLISH TOPIC "zone1/conveyor/cmd/stop" WITH 1
ADD COMPONENT "SpeedSetpoint" WITH TYPE "number-field"
AT COLUMN 1 ROW 2
SET LABEL "Speed Setpoint (%)"
SET PLACEHOLDER "0"
ON CHANGE DO
PUBLISH TOPIC "zone1/conveyor/cmd/speed" WITH VALUE
ADD COMPONENT "LiveSpeed" WITH TYPE "slider"
AT COLUMN 2 ROW 2
SET RANGE FROM 0 TO 100
SET UNIT "%"
BIND VALUE TO TOPIC "zone1/conveyor/speed"
```
**Adapt:** the command topics (`cmd/...`) and the feedback topic (`speed`) — keeping them separate means the slider reflects what the line is actually doing, not just the last setpoint sent.
## Panel backed by a LoT Model
**Goal:** when a [Model](/latest/lot-language/models/overview) already aggregates your data layer, bind to its fields instead of raw topics.
**Known issue (current HUB build).** `BIND … TO MODEL` bindings do not receive data yet, and `SET MODEL … WITH VALUE` write-back from panel handlers does not update model fields — so this recipe cannot be shown rendering live values and the setpoint field cannot write back. The syntax below follows the spec; in the meantime, bind widgets to the model's source topics (or its output topic with `JSON_PATH`) and publish setpoints to those topics directly.
```lot wrap theme={"theme":"css-variables","languages":{"custom":["/languages/lot.json"]}}
DEFINE PANEL PumpDashboard
WITH VISIBILITY PUBLIC
WITH STATE PUBLISHED
WITH TITLE "Pump System"
WITH LAYOUT "grid" COLUMNS 3
ADD COMPONENT "FlowGauge" WITH TYPE "gauge"
BIND VALUE TO MODEL "PumpSystem.flow_rate"
SET UNIT "L/min"
SET RANGE FROM 0 TO 500
ADD COMPONENT "PressureDisplay" WITH TYPE "value"
BIND VALUE TO MODEL "PumpSystem.pressure"
SET UNIT "bar"
SET DECIMALS 2
ADD COMPONENT "PumpStatus" WITH TYPE "indicator"
BIND STATE TO MODEL "PumpSystem.running"
SET ON_VALUE "true" WITH COLOR "success"
SET ON_VALUE "false" WITH COLOR "muted"
SET SIZE "large"
ADD COMPONENT "FlowSetpoint" WITH TYPE "number-field"
SET LABEL "Flow Setpoint (L/min)"
SET PLACEHOLDER "0"
BIND VALUE TO MODEL "PumpSystem.setpoint"
```
## Next Steps
Walk through one of these panels end to end with live data.
Publish, share, and put any of these on a wall screen.