> ## Documentation Index
> Fetch the complete documentation index at: https://docs.coreflux.org/llms.txt
> Use this file to discover all available pages before exploring further.
# Dashboards in the HUB
> Live panels bound to your broker data — written in the Dashboard Manager or generated by the AI Assistant.
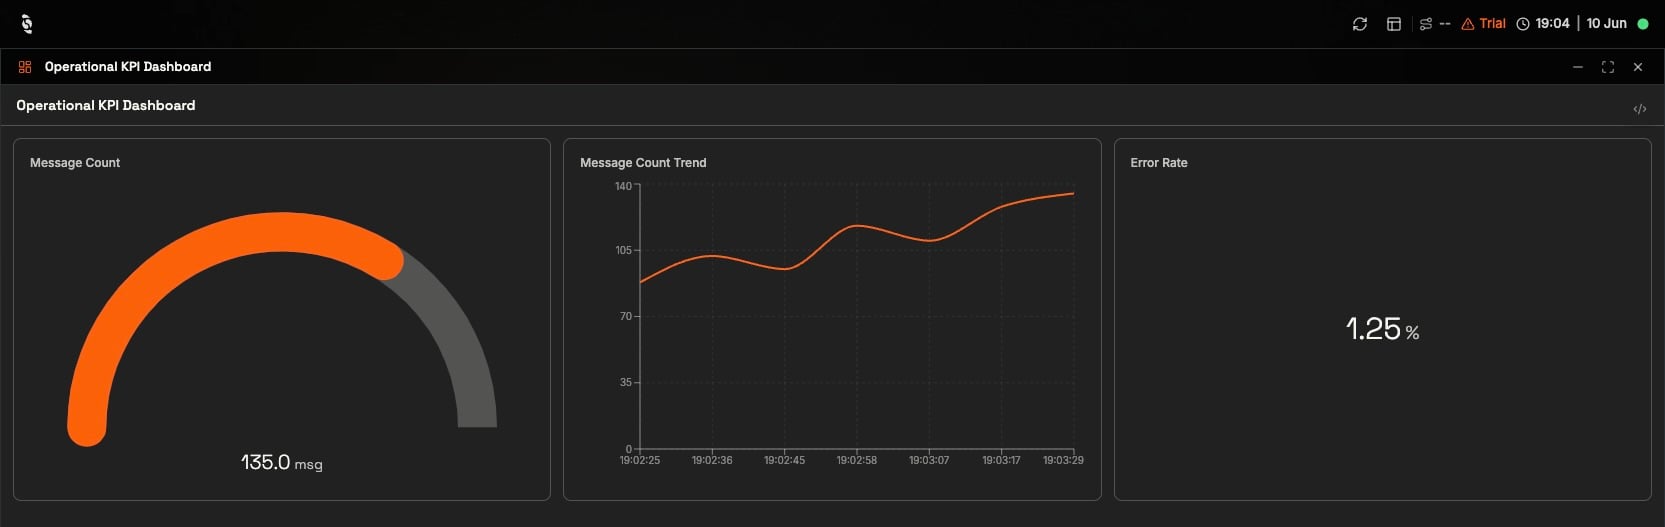 Dashboards in Coreflux are **panels**: live screens assembled from components — gauges, charts, controls — each wired to data flowing through your broker. You write them in the **Coreflux HUB** Dashboard Manager, where the panel definition and its live result sit side by side, or you ask the **AI Assistant** to build one for you and refine it from there.
**Like a control room sketched in plain text.** You describe a gauge, point it at a signal, and it shows that signal live from the moment you save — no wiring diagram, no deploy step.
## What you can build
* **KPI walls** — large readouts and trends for supervisors
* **Line and area overviews** — at-a-glance status for a process or zone
* **Machine detail** — gauges, indicators, and controls for a single asset
* **Operator stations** — buttons, toggles, and setpoints where people work the process
* **Shift and mobile views** — simplified layouts for tablets and shared screens
***
Panels are authored as **LoT (Language of Things)** definitions — the syntax is documented under [LoT PANEL](/latest/lot-language/panels/defining-panels), which versions with your broker. The rest of this page is a quick tour of what the HUB renders; every widget has a full reference linked at the end.
## Your first panel in 60 seconds
Open **Dashboards** in the HUB, click **Create new panel**, and write the definition below. The panel renders live as you save — point a gauge at a topic and the needle starts moving:
Dashboards in Coreflux are **panels**: live screens assembled from components — gauges, charts, controls — each wired to data flowing through your broker. You write them in the **Coreflux HUB** Dashboard Manager, where the panel definition and its live result sit side by side, or you ask the **AI Assistant** to build one for you and refine it from there.
**Like a control room sketched in plain text.** You describe a gauge, point it at a signal, and it shows that signal live from the moment you save — no wiring diagram, no deploy step.
## What you can build
* **KPI walls** — large readouts and trends for supervisors
* **Line and area overviews** — at-a-glance status for a process or zone
* **Machine detail** — gauges, indicators, and controls for a single asset
* **Operator stations** — buttons, toggles, and setpoints where people work the process
* **Shift and mobile views** — simplified layouts for tablets and shared screens
***
Panels are authored as **LoT (Language of Things)** definitions — the syntax is documented under [LoT PANEL](/latest/lot-language/panels/defining-panels), which versions with your broker. The rest of this page is a quick tour of what the HUB renders; every widget has a full reference linked at the end.
## Your first panel in 60 seconds
Open **Dashboards** in the HUB, click **Create new panel**, and write the definition below. The panel renders live as you save — point a gauge at a topic and the needle starts moving:
 ```lot wrap theme={"theme":"css-variables","languages":{"custom":["/languages/lot.json"]}}
DEFINE PANEL SensorMonitor
WITH VISIBILITY PUBLIC
WITH STATE PUBLISHED
WITH TITLE "Sensor Monitor"
WITH LAYOUT "grid" COLUMNS 2
ADD COMPONENT "TempGauge" WITH TYPE "gauge"
SET RANGE FROM 0 TO 100
SET UNIT "°C"
BIND VALUE TO TOPIC "sensor/temperature"
```
Every part of a definition is covered step by step in [Defining a Panel](/latest/lot-language/panels/defining-panels).
Describe what you want in plain language:
> "Build me a panel with a radial temperature gauge on `sensor/temperature`, range 0–100 °C, with a warning threshold at 75."
The assistant creates the panel for you. Open it in the Dashboard Manager to see the definition it wrote — and adjust anything directly. See [AI Assistant](/hub/ai-assistant).
Include `WITH VISIBILITY PUBLIC` **and** `WITH STATE PUBLISHED` in every panel definition — panels saved without them may not appear in the Dashboard Manager list. See [Defining a Panel](/latest/lot-language/panels/defining-panels).
## Tour of the main widgets
A quick taste of each family — every widget has a full reference page.
### Readouts
A value with context: range, unit, and thresholds.
```lot wrap theme={"theme":"css-variables","languages":{"custom":["/languages/lot.json"]}}
DEFINE PANEL SensorMonitor
WITH VISIBILITY PUBLIC
WITH STATE PUBLISHED
WITH TITLE "Sensor Monitor"
WITH LAYOUT "grid" COLUMNS 2
ADD COMPONENT "TempGauge" WITH TYPE "gauge"
SET RANGE FROM 0 TO 100
SET UNIT "°C"
BIND VALUE TO TOPIC "sensor/temperature"
```
Every part of a definition is covered step by step in [Defining a Panel](/latest/lot-language/panels/defining-panels).
Describe what you want in plain language:
> "Build me a panel with a radial temperature gauge on `sensor/temperature`, range 0–100 °C, with a warning threshold at 75."
The assistant creates the panel for you. Open it in the Dashboard Manager to see the definition it wrote — and adjust anything directly. See [AI Assistant](/hub/ai-assistant).
Include `WITH VISIBILITY PUBLIC` **and** `WITH STATE PUBLISHED` in every panel definition — panels saved without them may not appear in the Dashboard Manager list. See [Defining a Panel](/latest/lot-language/panels/defining-panels).
## Tour of the main widgets
A quick taste of each family — every widget has a full reference page.
### Readouts
A value with context: range, unit, and thresholds.
 ```lot wrap theme={"theme":"css-variables","languages":{"custom":["/languages/lot.json"]}}
ADD COMPONENT "TempGauge" WITH TYPE "gauge"
SET RANGE FROM 0 TO 100
SET UNIT "°C"
BIND VALUE TO TOPIC "sensor/temperature"
```
The big number — unit, decimals, wall-readable.
```lot wrap theme={"theme":"css-variables","languages":{"custom":["/languages/lot.json"]}}
ADD COMPONENT "TempGauge" WITH TYPE "gauge"
SET RANGE FROM 0 TO 100
SET UNIT "°C"
BIND VALUE TO TOPIC "sensor/temperature"
```
The big number — unit, decimals, wall-readable.
 ```lot wrap theme={"theme":"css-variables","languages":{"custom":["/languages/lot.json"]}}
ADD COMPONENT "ErrorRate" WITH TYPE "value"
SET LABEL "Error Rate"
SET UNIT "%"
SET DECIMALS 2
BIND VALUE TO TOPIC "kpi/operational/errorRate"
```
State at a glance — values mapped to colors.
```lot wrap theme={"theme":"css-variables","languages":{"custom":["/languages/lot.json"]}}
ADD COMPONENT "ErrorRate" WITH TYPE "value"
SET LABEL "Error Rate"
SET UNIT "%"
SET DECIMALS 2
BIND VALUE TO TOPIC "kpi/operational/errorRate"
```
State at a glance — values mapped to colors.
 ```lot wrap theme={"theme":"css-variables","languages":{"custom":["/languages/lot.json"]}}
ADD COMPONENT "MachineStatus" WITH TYPE "indicator"
BIND STATE TO TOPIC "machine/status"
SET ON_VALUE "running" WITH COLOR "green"
SET ON_VALUE "stopped" WITH COLOR "red"
```
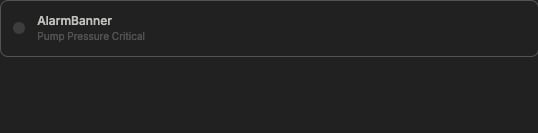
A banner that appears when a condition is true.
```lot wrap theme={"theme":"css-variables","languages":{"custom":["/languages/lot.json"]}}
ADD COMPONENT "MachineStatus" WITH TYPE "indicator"
BIND STATE TO TOPIC "machine/status"
SET ON_VALUE "running" WITH COLOR "green"
SET ON_VALUE "stopped" WITH COLOR "red"
```
A banner that appears when a condition is true.
 ```lot wrap theme={"theme":"css-variables","languages":{"custom":["/languages/lot.json"]}}
ADD COMPONENT "AlarmBanner" WITH TYPE "alert"
BIND VISIBLE TO TOPIC "pump/alarm_active"
BIND CONTENT TO TOPIC "pump/alarm_message"
SET VARIANT "critical"
```
### Charts and tables
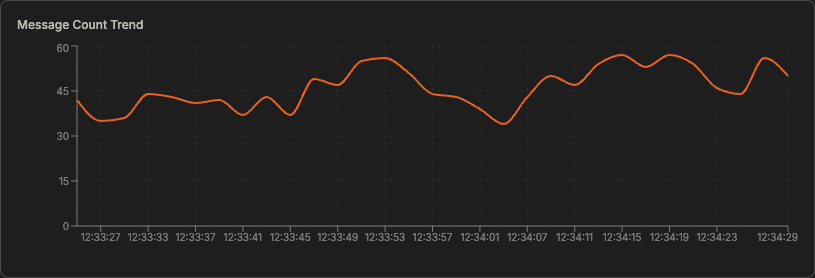
Builds a live trend from individual data points on a topic.
```lot wrap theme={"theme":"css-variables","languages":{"custom":["/languages/lot.json"]}}
ADD COMPONENT "AlarmBanner" WITH TYPE "alert"
BIND VISIBLE TO TOPIC "pump/alarm_active"
BIND CONTENT TO TOPIC "pump/alarm_message"
SET VARIANT "critical"
```
### Charts and tables
Builds a live trend from individual data points on a topic.
 ```lot wrap theme={"theme":"css-variables","languages":{"custom":["/languages/lot.json"]}}
ADD COMPONENT "MessageCountTrend" WITH TYPE "realtime-chart"
SET LABEL "Message Count Trend"
SET CHART_TYPE "line"
SET UNIT "msg"
BIND VALUE TO TOPIC "kpi/operational/messageCount"
SET SERIES_LABEL "Message Count"
```
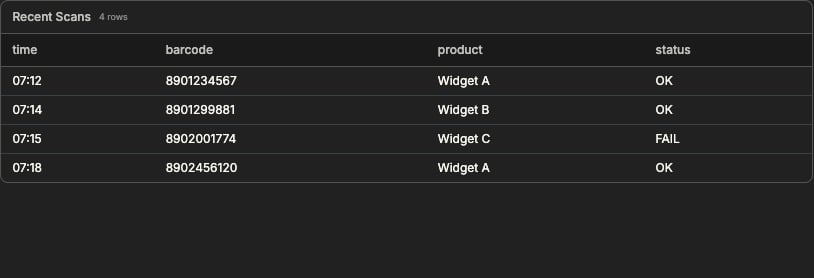
Rows from a JSON array topic or query result.
```lot wrap theme={"theme":"css-variables","languages":{"custom":["/languages/lot.json"]}}
ADD COMPONENT "MessageCountTrend" WITH TYPE "realtime-chart"
SET LABEL "Message Count Trend"
SET CHART_TYPE "line"
SET UNIT "msg"
BIND VALUE TO TOPIC "kpi/operational/messageCount"
SET SERIES_LABEL "Message Count"
```
Rows from a JSON array topic or query result.
 ```lot wrap theme={"theme":"css-variables","languages":{"custom":["/languages/lot.json"]}}
ADD COMPONENT "ScanHistory" WITH TYPE "table"
BIND DATA TO TOPIC "barcode/history"
SET COLUMNS "time, barcode, product, status"
```
### Controls
On/off switch that tracks the live state of its bound topic.
```lot wrap theme={"theme":"css-variables","languages":{"custom":["/languages/lot.json"]}}
ADD COMPONENT "ScanHistory" WITH TYPE "table"
BIND DATA TO TOPIC "barcode/history"
SET COLUMNS "time, barcode, product, status"
```
### Controls
On/off switch that tracks the live state of its bound topic.
 ```lot wrap theme={"theme":"css-variables","languages":{"custom":["/languages/lot.json"]}}
ADD COMPONENT "PumpControl" WITH TYPE "toggle"
SET LABEL "Pump Enable"
BIND STATE TO TOPIC "zone1/pump/state"
```
Click to act — publish a command to any topic, or navigate to another panel.
```lot wrap theme={"theme":"css-variables","languages":{"custom":["/languages/lot.json"]}}
ADD COMPONENT "PumpControl" WITH TYPE "toggle"
SET LABEL "Pump Enable"
BIND STATE TO TOPIC "zone1/pump/state"
```
Click to act — publish a command to any topic, or navigate to another panel.
 ```lot wrap theme={"theme":"css-variables","languages":{"custom":["/languages/lot.json"]}}
ADD COMPONENT "StartButton" WITH TYPE "button"
SET LABEL "Start Production"
ON CLICK DO
PUBLISH TOPIC "factory/commands/start" WITH 1
```
Numeric value tracked live on a range.
```lot wrap theme={"theme":"css-variables","languages":{"custom":["/languages/lot.json"]}}
ADD COMPONENT "StartButton" WITH TYPE "button"
SET LABEL "Start Production"
ON CLICK DO
PUBLISH TOPIC "factory/commands/start" WITH 1
```
Numeric value tracked live on a range.
 ```lot wrap theme={"theme":"css-variables","languages":{"custom":["/languages/lot.json"]}}
ADD COMPONENT "SpeedSlider" WITH TYPE "slider"
SET RANGE FROM 0 TO 100
SET UNIT "%"
BIND VALUE TO TOPIC "zone1/conveyor/speed"
```
## What dashboards can do
* **Live bindings** — bind to MQTT topics, LoT Model fields, or database queries; widgets update the moment values change. See [Data Binding](/latest/lot-language/panels/data-binding).
* **Interactive controls** — buttons and entry fields that publish commands, invoke Actions, and trigger Routes. See [Actions & Events](/latest/lot-language/panels/actions-events).
* **Multi-page navigation** — buttons and cards that jump between panels with `NAVIGATE`, for overview-to-detail drill-downs. See [Defining a Panel](/latest/lot-language/panels/defining-panels#navigation).
* **Share on any screen** — a panel URL runs full-screen on wall TVs, tablets, and kiosks, no app install. See [Dashboards in the HUB](/hub/dashboards/overview).
## Next Steps
A 10-minute guided walk from topic to published panel.
Every widget, every property, every bind target.
```lot wrap theme={"theme":"css-variables","languages":{"custom":["/languages/lot.json"]}}
ADD COMPONENT "SpeedSlider" WITH TYPE "slider"
SET RANGE FROM 0 TO 100
SET UNIT "%"
BIND VALUE TO TOPIC "zone1/conveyor/speed"
```
## What dashboards can do
* **Live bindings** — bind to MQTT topics, LoT Model fields, or database queries; widgets update the moment values change. See [Data Binding](/latest/lot-language/panels/data-binding).
* **Interactive controls** — buttons and entry fields that publish commands, invoke Actions, and trigger Routes. See [Actions & Events](/latest/lot-language/panels/actions-events).
* **Multi-page navigation** — buttons and cards that jump between panels with `NAVIGATE`, for overview-to-detail drill-downs. See [Defining a Panel](/latest/lot-language/panels/defining-panels#navigation).
* **Share on any screen** — a panel URL runs full-screen on wall TVs, tablets, and kiosks, no app install. See [Dashboards in the HUB](/hub/dashboards/overview).
## Next Steps
A 10-minute guided walk from topic to published panel.
Every widget, every property, every bind target.