> ## Documentation Index
> Fetch the complete documentation index at: https://docs.coreflux.org/llms.txt
> Use this file to discover all available pages before exploring further.
# Display Components
> Read-only widgets: gauges, values, indicators, charts, tables, and alerts.
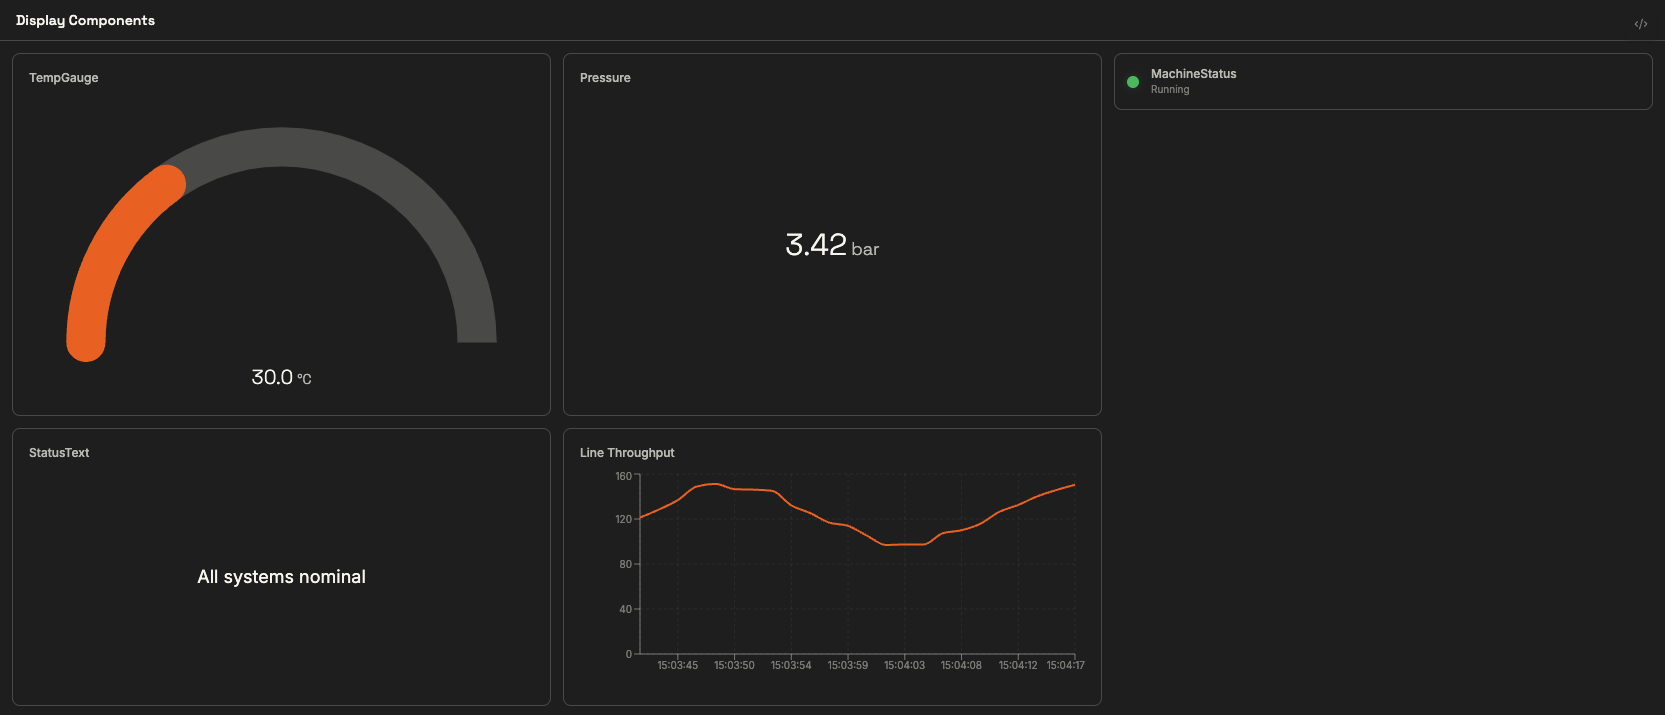 Display components show live data without accepting input. Each entry below opens with tabbed examples — the rendered result above the code that produces it — followed by the property reference.
**Like instruments on a car dashboard.** Each one reads a signal and shows it its own way — a dial, a number, a warning light — and none of them lets you steer.
***
## Gauge
Circular (radial) or linear gauge for numeric values.
A radial gauge bound to a temperature topic:
Display components show live data without accepting input. Each entry below opens with tabbed examples — the rendered result above the code that produces it — followed by the property reference.
**Like instruments on a car dashboard.** Each one reads a signal and shows it its own way — a dial, a number, a warning light — and none of them lets you steer.
***
## Gauge
Circular (radial) or linear gauge for numeric values.
A radial gauge bound to a temperature topic:
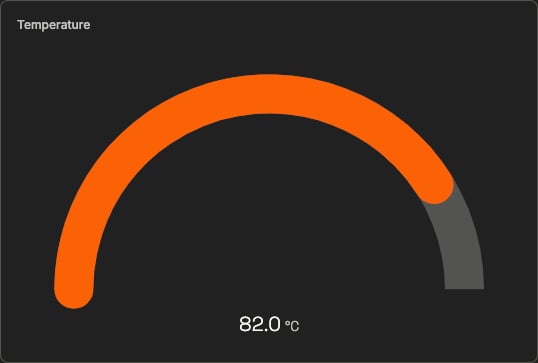 ```lot wrap theme={"theme":"css-variables","languages":{"custom":["/languages/lot.json"]}}
ADD COMPONENT "TempGauge" WITH TYPE "gauge"
SET RANGE FROM 0 TO 100
SET UNIT "°C"
BIND VALUE TO TOPIC "sensor/temperature"
```
A gauge with a label, one decimal place, and two configured thresholds:
```lot wrap theme={"theme":"css-variables","languages":{"custom":["/languages/lot.json"]}}
ADD COMPONENT "TempGauge" WITH TYPE "gauge"
SET RANGE FROM 0 TO 100
SET UNIT "°C"
BIND VALUE TO TOPIC "sensor/temperature"
```
A gauge with a label, one decimal place, and two configured thresholds:
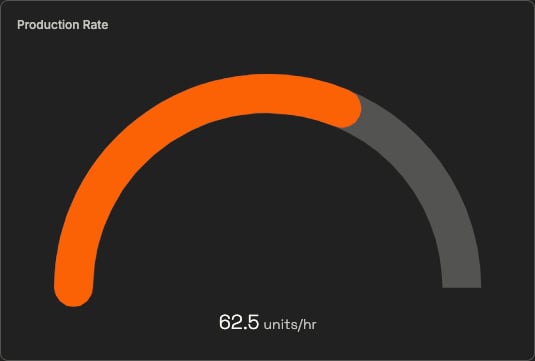 ```lot wrap theme={"theme":"css-variables","languages":{"custom":["/languages/lot.json"]}}
ADD COMPONENT "ProductionGauge" WITH TYPE "gauge"
SET STYLE "radial"
SET RANGE FROM 0 TO 100
SET UNIT "units/hr"
SET LABEL "Production Rate"
SET DECIMALS 1
BIND VALUE TO TOPIC "factory/production/rate"
ADD THRESHOLD AT 75 WITH COLOR "warning" LABEL "High"
ADD THRESHOLD AT 90 WITH COLOR "critical" LABEL "Critical"
```
| Property | Type | Default | Description |
| ------------------- | ----------------------- | ---------- | ---------------- |
| `STYLE` | `"radial"` / `"linear"` | `"radial"` | Gauge appearance |
| `RANGE FROM x TO y` | Numbers | required | Min / max values |
| `UNIT` | String | `""` | Unit label |
| `LABEL` | String | `""` | Display label |
| `DECIMALS` | Integer | `0` | Decimal places |
**Bind targets:** `VALUE`, `MIN`, `MAX`
## Value
The simplest read-only display: a number or string, with unit and formatting.
A pressure readout with two decimals:
```lot wrap theme={"theme":"css-variables","languages":{"custom":["/languages/lot.json"]}}
ADD COMPONENT "ProductionGauge" WITH TYPE "gauge"
SET STYLE "radial"
SET RANGE FROM 0 TO 100
SET UNIT "units/hr"
SET LABEL "Production Rate"
SET DECIMALS 1
BIND VALUE TO TOPIC "factory/production/rate"
ADD THRESHOLD AT 75 WITH COLOR "warning" LABEL "High"
ADD THRESHOLD AT 90 WITH COLOR "critical" LABEL "Critical"
```
| Property | Type | Default | Description |
| ------------------- | ----------------------- | ---------- | ---------------- |
| `STYLE` | `"radial"` / `"linear"` | `"radial"` | Gauge appearance |
| `RANGE FROM x TO y` | Numbers | required | Min / max values |
| `UNIT` | String | `""` | Unit label |
| `LABEL` | String | `""` | Display label |
| `DECIMALS` | Integer | `0` | Decimal places |
**Bind targets:** `VALUE`, `MIN`, `MAX`
## Value
The simplest read-only display: a number or string, with unit and formatting.
A pressure readout with two decimals:
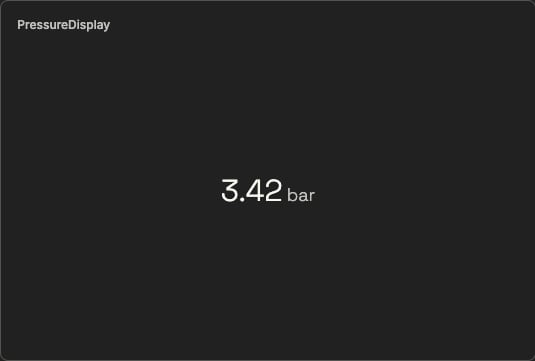 ```lot wrap theme={"theme":"css-variables","languages":{"custom":["/languages/lot.json"]}}
ADD COMPONENT "PressureDisplay" WITH TYPE "value"
BIND VALUE TO TOPIC "pump/pressure"
SET UNIT "bar"
SET DECIMALS 2
```
Extracting one field from a JSON MQTT payload — `JSON_PATH` and the label are the new parts:
```lot wrap theme={"theme":"css-variables","languages":{"custom":["/languages/lot.json"]}}
ADD COMPONENT "PressureDisplay" WITH TYPE "value"
BIND VALUE TO TOPIC "pump/pressure"
SET UNIT "bar"
SET DECIMALS 2
```
Extracting one field from a JSON MQTT payload — `JSON_PATH` and the label are the new parts:
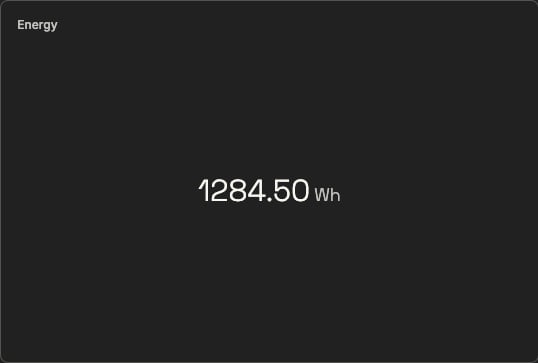 ```lot wrap focus={3,5} theme={"theme":"css-variables","languages":{"custom":["/languages/lot.json"]}}
ADD COMPONENT "EnergyDisplay" WITH TYPE "value"
BIND VALUE TO TOPIC "machines/pump1/data"
SET JSON_PATH "$.energy_wh"
SET UNIT "Wh"
SET LABEL "Energy"
SET DECIMALS 2
```
| Property | Type | Default | Description |
| ----------- | ------- | ------- | -------------------------------- |
| `UNIT` | String | `""` | Unit label |
| `LABEL` | String | `""` | Display label |
| `DECIMALS` | Integer | `0` | Decimal places |
| `JSON_PATH` | String | — | JSONPath to extract from payload |
**Bind targets:** `VALUE`, `MAX`
If your topic carries a JSON object rather than a plain number, set `JSON_PATH` to pick the field — otherwise the widget shows the raw payload. Inspect the payload first in the [Data Viewer](/hub/mqtt/data-viewer).
## Text / Label
Dynamic or static text. `label` is an alias for `text`.
A static heading rendered at large size:
```lot wrap focus={3,5} theme={"theme":"css-variables","languages":{"custom":["/languages/lot.json"]}}
ADD COMPONENT "EnergyDisplay" WITH TYPE "value"
BIND VALUE TO TOPIC "machines/pump1/data"
SET JSON_PATH "$.energy_wh"
SET UNIT "Wh"
SET LABEL "Energy"
SET DECIMALS 2
```
| Property | Type | Default | Description |
| ----------- | ------- | ------- | -------------------------------- |
| `UNIT` | String | `""` | Unit label |
| `LABEL` | String | `""` | Display label |
| `DECIMALS` | Integer | `0` | Decimal places |
| `JSON_PATH` | String | — | JSONPath to extract from payload |
**Bind targets:** `VALUE`, `MAX`
If your topic carries a JSON object rather than a plain number, set `JSON_PATH` to pick the field — otherwise the widget shows the raw payload. Inspect the payload first in the [Data Viewer](/hub/mqtt/data-viewer).
## Text / Label
Dynamic or static text. `label` is an alias for `text`.
A static heading rendered at large size:
 ```lot wrap theme={"theme":"css-variables","languages":{"custom":["/languages/lot.json"]}}
ADD COMPONENT "SectionTitle" WITH TYPE "label"
SET LABEL "Zone 1 Overview"
SET SIZE "large"
```
Dynamic text whose content updates live from the broker — the `BIND CONTENT` line is what makes it live:
```lot wrap theme={"theme":"css-variables","languages":{"custom":["/languages/lot.json"]}}
ADD COMPONENT "SectionTitle" WITH TYPE "label"
SET LABEL "Zone 1 Overview"
SET SIZE "large"
```
Dynamic text whose content updates live from the broker — the `BIND CONTENT` line is what makes it live:
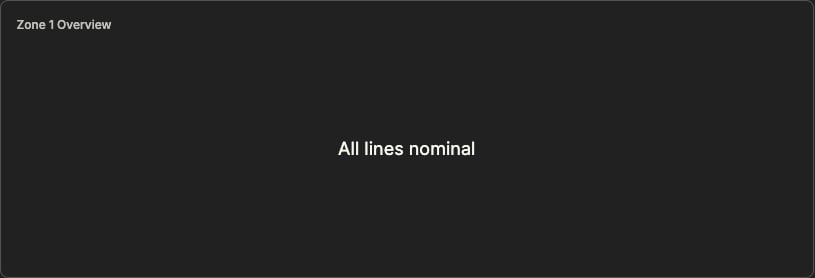 ```lot wrap focus={2} theme={"theme":"css-variables","languages":{"custom":["/languages/lot.json"]}}
ADD COMPONENT "StatusText" WITH TYPE "text"
BIND CONTENT TO TOPIC "system/message"
SET SIZE "large"
```
| Property | Type | Default | Description |
| -------- | ---------------------------------- | ----------- | ----------- |
| `SIZE` | `"small"` / `"medium"` / `"large"` | `"medium"` | Font size |
| `COLOR` | Color string | `"inherit"` | Text color |
**Bind targets:** `CONTENT`, `COLOR`, `TITLE`, `LABEL`
## Indicator
Maps incoming values to colors — running/stopped/fault at a glance.
A pump-running dot — green when the bound topic reads `true`:
```lot wrap focus={2} theme={"theme":"css-variables","languages":{"custom":["/languages/lot.json"]}}
ADD COMPONENT "StatusText" WITH TYPE "text"
BIND CONTENT TO TOPIC "system/message"
SET SIZE "large"
```
| Property | Type | Default | Description |
| -------- | ---------------------------------- | ----------- | ----------- |
| `SIZE` | `"small"` / `"medium"` / `"large"` | `"medium"` | Font size |
| `COLOR` | Color string | `"inherit"` | Text color |
**Bind targets:** `CONTENT`, `COLOR`, `TITLE`, `LABEL`
## Indicator
Maps incoming values to colors — running/stopped/fault at a glance.
A pump-running dot — green when the bound topic reads `true`:
 ```lot wrap theme={"theme":"css-variables","languages":{"custom":["/languages/lot.json"]}}
ADD COMPONENT "PumpIndicator" WITH TYPE "indicator"
BIND STATE TO TOPIC "pump/running"
SET ON_VALUE "true" WITH COLOR "success"
SET ON_VALUE "false" WITH COLOR "muted"
```
Three states mapped to three colors, rendered large — the extra mapping and size are highlighted:
```lot wrap theme={"theme":"css-variables","languages":{"custom":["/languages/lot.json"]}}
ADD COMPONENT "PumpIndicator" WITH TYPE "indicator"
BIND STATE TO TOPIC "pump/running"
SET ON_VALUE "true" WITH COLOR "success"
SET ON_VALUE "false" WITH COLOR "muted"
```
Three states mapped to three colors, rendered large — the extra mapping and size are highlighted:
 ```lot wrap theme={"theme":"css-variables","languages":{"custom":["/languages/lot.json"]}}
ADD COMPONENT "MachineStatus" WITH TYPE "indicator"
BIND STATE TO TOPIC "machine/status"
SET ON_VALUE "running" WITH COLOR "green"
SET ON_VALUE "stopped" WITH COLOR "red"
SET ON_VALUE "maintenance" WITH COLOR "yellow"
SET SIZE "large"
```
| Property | Type | Default | Description |
| ---------- | ---------------------------------- | ---------- | ----------------------------------- |
| `ON_VALUE` | `"state" WITH COLOR "color"` | required | One or more value-to-color mappings |
| `SIZE` | `"small"` / `"medium"` / `"large"` | `"medium"` | Indicator dot size |
**Bind targets:** `STATE`
## Realtime Chart
Live streaming chart — it receives **individual data points** from a topic and builds the trend itself.
One topic, one trace — every published value becomes a point:
```lot wrap theme={"theme":"css-variables","languages":{"custom":["/languages/lot.json"]}}
ADD COMPONENT "MachineStatus" WITH TYPE "indicator"
BIND STATE TO TOPIC "machine/status"
SET ON_VALUE "running" WITH COLOR "green"
SET ON_VALUE "stopped" WITH COLOR "red"
SET ON_VALUE "maintenance" WITH COLOR "yellow"
SET SIZE "large"
```
| Property | Type | Default | Description |
| ---------- | ---------------------------------- | ---------- | ----------------------------------- |
| `ON_VALUE` | `"state" WITH COLOR "color"` | required | One or more value-to-color mappings |
| `SIZE` | `"small"` / `"medium"` / `"large"` | `"medium"` | Indicator dot size |
**Bind targets:** `STATE`
## Realtime Chart
Live streaming chart — it receives **individual data points** from a topic and builds the trend itself.
One topic, one trace — every published value becomes a point:
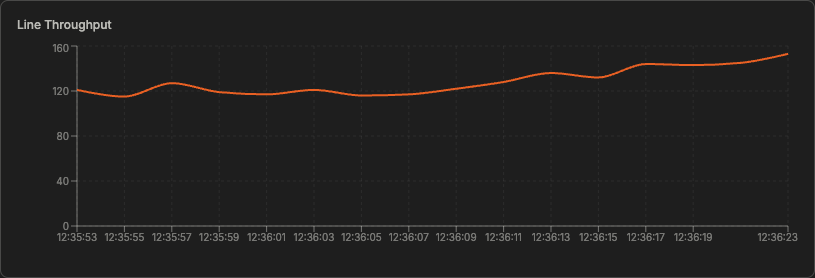 ```lot wrap theme={"theme":"css-variables","languages":{"custom":["/languages/lot.json"]}}
ADD COMPONENT "ThroughputTrend" WITH TYPE "realtime-chart"
SET LABEL "Line Throughput"
BIND VALUE TO TOPIC "factory/throughput"
```
The same idea with an explicit chart type, a y-axis unit, and a series label — the additions are highlighted:
```lot wrap theme={"theme":"css-variables","languages":{"custom":["/languages/lot.json"]}}
ADD COMPONENT "ThroughputTrend" WITH TYPE "realtime-chart"
SET LABEL "Line Throughput"
BIND VALUE TO TOPIC "factory/throughput"
```
The same idea with an explicit chart type, a y-axis unit, and a series label — the additions are highlighted:
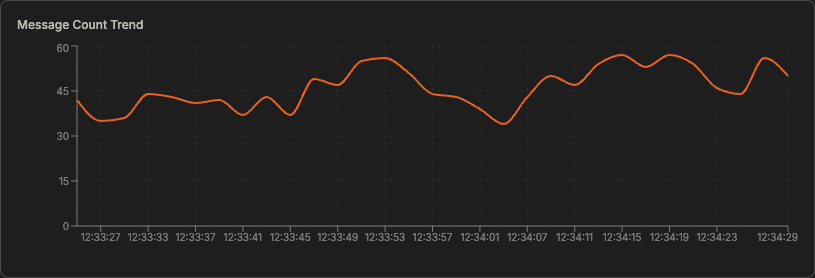 ```lot wrap theme={"theme":"css-variables","languages":{"custom":["/languages/lot.json"]}}
ADD COMPONENT "MessageCountTrend" WITH TYPE "realtime-chart"
SET LABEL "Message Count Trend"
SET CHART_TYPE "line"
SET UNIT "msg"
BIND VALUE TO TOPIC "kpi/operational/messageCount"
SET SERIES_LABEL "Message Count"
```
**Multi-series is not working in the current HUB build.** Adding a second `BIND VALUE TO TOPIC` (each with its own indented `SET SERIES_LABEL`) is the documented syntax for multiple traces, but the chart currently renders a single trace and no legend. Use one chart per signal for now.
| Property | Type | Description |
| -------------- | ------------------ | ------------------------------------------------------ |
| `CHART_TYPE` | `"line"` / `"bar"` | Trace style (the current build renders both as a line) |
| `UNIT` | String | Y-axis unit label |
| `LABEL` | String | Chart heading |
| `SERIES_LABEL` | String | Series name — set **under the BIND, indented** |
**Bind target:** `VALUE`
## Image
Static, dynamic, or camera-fed image.
A static image loaded from a URL:
```lot wrap theme={"theme":"css-variables","languages":{"custom":["/languages/lot.json"]}}
ADD COMPONENT "MessageCountTrend" WITH TYPE "realtime-chart"
SET LABEL "Message Count Trend"
SET CHART_TYPE "line"
SET UNIT "msg"
BIND VALUE TO TOPIC "kpi/operational/messageCount"
SET SERIES_LABEL "Message Count"
```
**Multi-series is not working in the current HUB build.** Adding a second `BIND VALUE TO TOPIC` (each with its own indented `SET SERIES_LABEL`) is the documented syntax for multiple traces, but the chart currently renders a single trace and no legend. Use one chart per signal for now.
| Property | Type | Description |
| -------------- | ------------------ | ------------------------------------------------------ |
| `CHART_TYPE` | `"line"` / `"bar"` | Trace style (the current build renders both as a line) |
| `UNIT` | String | Y-axis unit label |
| `LABEL` | String | Chart heading |
| `SERIES_LABEL` | String | Series name — set **under the BIND, indented** |
**Bind target:** `VALUE`
## Image
Static, dynamic, or camera-fed image.
A static image loaded from a URL:
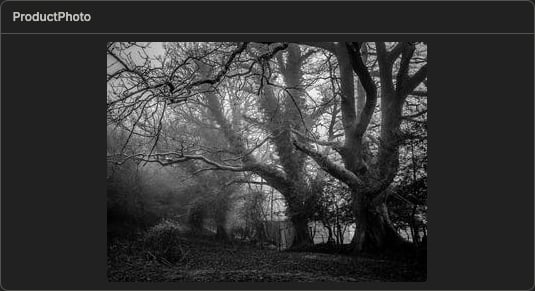 ```lot wrap theme={"theme":"css-variables","languages":{"custom":["/languages/lot.json"]}}
ADD COMPONENT "ProductPhoto" WITH TYPE "image"
SET SRC "https://picsum.photos/320/240"
SET WIDTH 320
SET HEIGHT 240
```
A live feed whose source URL is published over MQTT — the `BIND SRC` line replaces the static source:
```lot wrap theme={"theme":"css-variables","languages":{"custom":["/languages/lot.json"]}}
ADD COMPONENT "ProductPhoto" WITH TYPE "image"
SET SRC "https://picsum.photos/320/240"
SET WIDTH 320
SET HEIGHT 240
```
A live feed whose source URL is published over MQTT — the `BIND SRC` line replaces the static source:
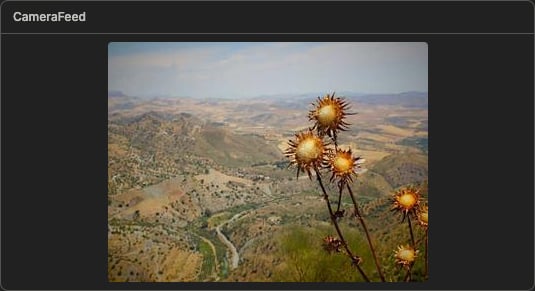 ```lot wrap theme={"theme":"css-variables","languages":{"custom":["/languages/lot.json"]}}
ADD COMPONENT "CameraFeed" WITH TYPE "image"
BIND SRC TO TOPIC "camera/1/snapshot"
SET WIDTH 320
SET HEIGHT 240
```
| Property | Type | Description |
| ----------------- | ------------------ | ------------------------------ |
| `SRC` | String / ENV / URL | Image source path or URL |
| `FALLBACK` | String | Fallback image if source fails |
| `WIDTH`, `HEIGHT` | Integer | Dimensions in pixels |
**Bind targets:** `SRC`, `VISIBLE`
## Table
Tabular data from a JSON array topic or a query result.
Each array element becomes a row; `COLUMNS` picks and orders the fields:
```lot wrap theme={"theme":"css-variables","languages":{"custom":["/languages/lot.json"]}}
ADD COMPONENT "CameraFeed" WITH TYPE "image"
BIND SRC TO TOPIC "camera/1/snapshot"
SET WIDTH 320
SET HEIGHT 240
```
| Property | Type | Description |
| ----------------- | ------------------ | ------------------------------ |
| `SRC` | String / ENV / URL | Image source path or URL |
| `FALLBACK` | String | Fallback image if source fails |
| `WIDTH`, `HEIGHT` | Integer | Dimensions in pixels |
**Bind targets:** `SRC`, `VISIBLE`
## Table
Tabular data from a JSON array topic or a query result.
Each array element becomes a row; `COLUMNS` picks and orders the fields:
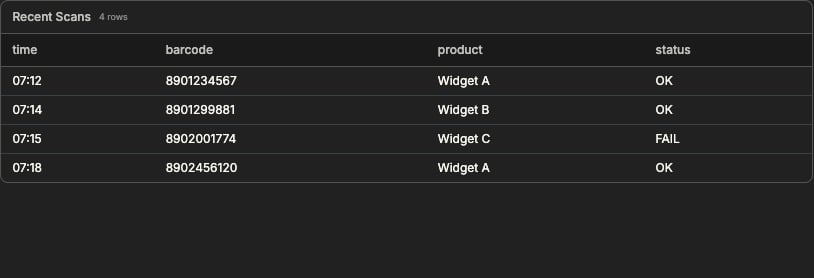 ```lot wrap theme={"theme":"css-variables","languages":{"custom":["/languages/lot.json"]}}
ADD COMPONENT "ScanHistory" WITH TYPE "table"
BIND DATA TO TOPIC "barcode/history"
SET COLUMNS "time, barcode, product, status"
SET MAX_ROWS 10
```
| Property | Type | Description |
| ---------- | ------- | ---------------------------- |
| `COLUMNS` | String | Comma-separated column names |
| `MAX_ROWS` | Integer | Maximum rows to display |
**Bind targets:** `DATA`
## List
Scrollable list of items from a topic or model.
```lot wrap theme={"theme":"css-variables","languages":{"custom":["/languages/lot.json"]}}
ADD COMPONENT "ScanHistory" WITH TYPE "table"
BIND DATA TO TOPIC "barcode/history"
SET COLUMNS "time, barcode, product, status"
SET MAX_ROWS 10
```
| Property | Type | Description |
| ---------- | ------- | ---------------------------- |
| `COLUMNS` | String | Comma-separated column names |
| `MAX_ROWS` | Integer | Maximum rows to display |
**Bind targets:** `DATA`
## List
Scrollable list of items from a topic or model.
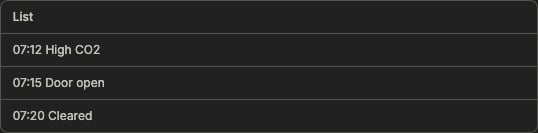 ```lot wrap theme={"theme":"css-variables","languages":{"custom":["/languages/lot.json"]}}
ADD COMPONENT "AlarmLog" WITH TYPE "list"
BIND DATA TO TOPIC "zone1/alarms"
```
**Bind targets:** `DATA`
## Alert
Banner for critical messages — typically bound to an alarm flag.
The banner appears while the alarm flag is true and shows the live message:
```lot wrap theme={"theme":"css-variables","languages":{"custom":["/languages/lot.json"]}}
ADD COMPONENT "AlarmLog" WITH TYPE "list"
BIND DATA TO TOPIC "zone1/alarms"
```
**Bind targets:** `DATA`
## Alert
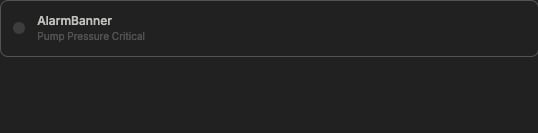
Banner for critical messages — typically bound to an alarm flag.
The banner appears while the alarm flag is true and shows the live message:
 ```lot wrap theme={"theme":"css-variables","languages":{"custom":["/languages/lot.json"]}}
ADD COMPONENT "AlarmBanner" WITH TYPE "alert"
BIND VISIBLE TO TOPIC "pump/alarm_active"
BIND CONTENT TO TOPIC "pump/alarm_message"
SET VARIANT "critical"
```
In the current HUB build the `critical` variant renders in a neutral/muted style rather than a strong red banner — the message and visibility behaviour work as shown.
| Property | Type | Description |
| ------------------ | ------------------------------------- | -------------- |
| `TYPE` / `VARIANT` | `"critical"` / `"warning"` / `"info"` | Severity style |
**Bind targets:** `CONTENT`, `VISIBLE`
## Common mistakes
Properties use `SET`, never `WITH`. `WITH UNIT "msg"`, `WITH RANGE 0, 200`, and `WITH DECIMALS 2` are silently ignored — write `SET UNIT "msg"`, `SET RANGE FROM 0 TO 200`, `SET DECIMALS 2`.
The topic carries a JSON object — add `SET JSON_PATH "$.field"` to extract the field you want, and confirm the payload shape in the Data Viewer.
## Next Steps
Buttons, toggles, sliders, and fields that write back to the broker.
Topics, models, queries, transformations, and JSON extraction.
```lot wrap theme={"theme":"css-variables","languages":{"custom":["/languages/lot.json"]}}
ADD COMPONENT "AlarmBanner" WITH TYPE "alert"
BIND VISIBLE TO TOPIC "pump/alarm_active"
BIND CONTENT TO TOPIC "pump/alarm_message"
SET VARIANT "critical"
```
In the current HUB build the `critical` variant renders in a neutral/muted style rather than a strong red banner — the message and visibility behaviour work as shown.
| Property | Type | Description |
| ------------------ | ------------------------------------- | -------------- |
| `TYPE` / `VARIANT` | `"critical"` / `"warning"` / `"info"` | Severity style |
**Bind targets:** `CONTENT`, `VISIBLE`
## Common mistakes
Properties use `SET`, never `WITH`. `WITH UNIT "msg"`, `WITH RANGE 0, 200`, and `WITH DECIMALS 2` are silently ignored — write `SET UNIT "msg"`, `SET RANGE FROM 0 TO 200`, `SET DECIMALS 2`.
The topic carries a JSON object — add `SET JSON_PATH "$.field"` to extract the field you want, and confirm the payload shape in the Data Viewer.
## Next Steps
Buttons, toggles, sliders, and fields that write back to the broker.
Topics, models, queries, transformations, and JSON extraction.